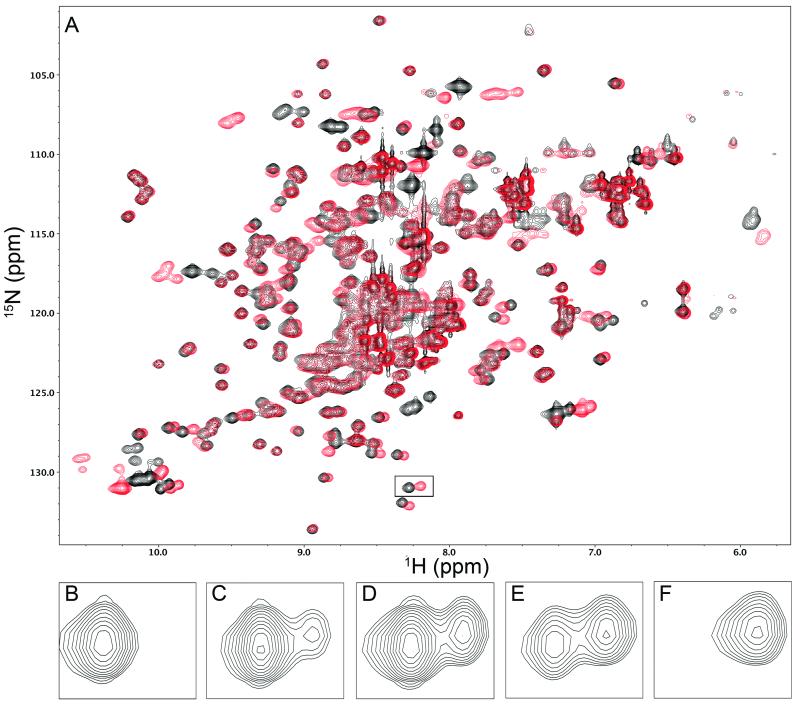
FIGURE 7.
Representative NMR data used to estimate the dissociation constant KD for 3α,6α-mannopentaose binding to BOA. Panel A shows the 1H-15N HSQC spectrum of BOA. The black spectrum, recorded in the absence of ligand, represents the starting point of the titration, while the red spectrum, recorded in the presence of a saturating excess of ligand, represents the end of the titration. Panels B-F illustrate the titration of the boxed signal located at (8.25, 131) ppm in panel A. In panels B-F, the sugar:protein molar ratios are 0, 1.45, 2.5, 4.0, and 27.2, respectively. With increasing sugar, the signal from free BOA (left cross-peak in each panel) decreases in intensity, while the signal from sugar-bound protein (right cross-peak) grows in intensity. The KD was estimated from the volumes of the cross-peaks in each pair that were fitted to Gaussian profiles using NMRPipe utilities.

