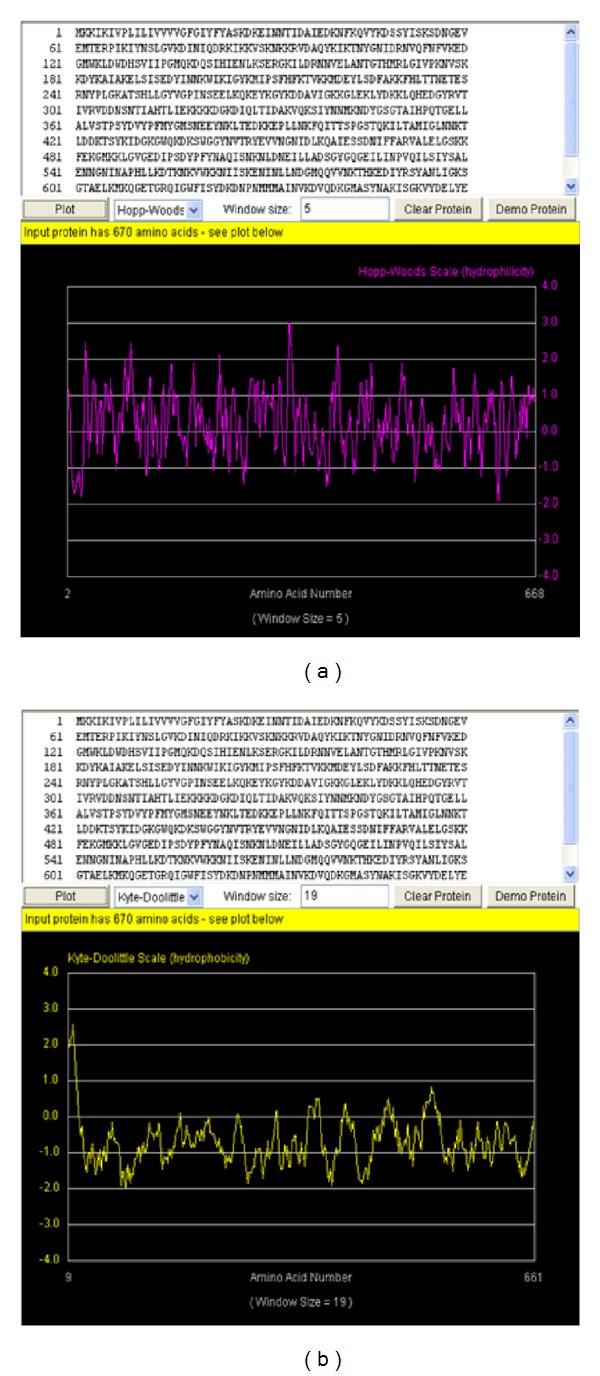
Figure 1.

The hydropathy plot for PBP-2′ protein. The yellow plot (b) is the Kyte-Doolittle hydrophobicity plot. Sections of the plot with high values >0.0 are highly hydrophobic or membrane spanning segments. The magenta plot (a) is the Hopp-Wood hydrophilicity plot. Higher values above >0.0 predict rich charge exposed regions with potential antigenic site. PBP2′ gene shows potential antigenic sites with values ≥2. Above the plots are the PBP2′ amino acids sequence with 670 residues.
