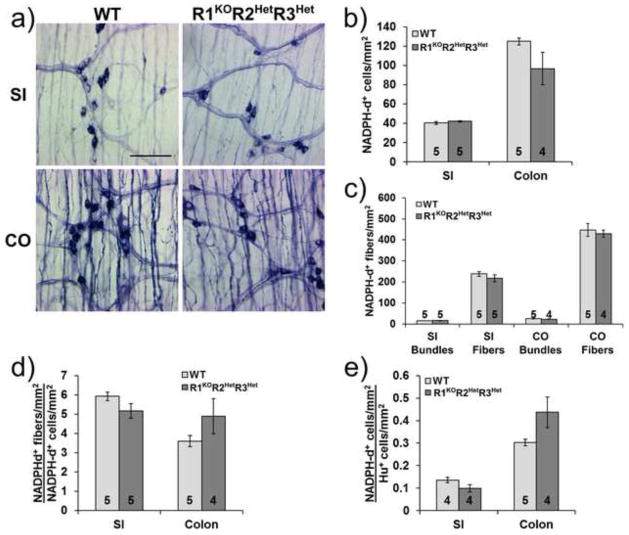
Figure 4. Nitrergic neuron and nerve fiber density is similar to WT in the myenteric plexus of R1KOR2HetR3Het mice.
a) Representative NADPH diaphorase (NADPH-d) stained whole mount preparations from WT and R1KOR2HetR3Het mice show nitrergic neurons and fibers in the small intestine and colon. Scale bar: 100 μm. b) Quantification of myenteric plexus nitrergic neuron density c) Quantification of myenteric nitrergic fiber density. d) Ratio of fiber density to neuron cell body density. e) Ratio of nitrergic neuron (NADPH-d) density to total neuron (Hu) density. Number of animals analyzed is indicated on each bar. R1KOR2HetR3Het measurements were not statistically different from WT for any comparisons (p>0.05).

