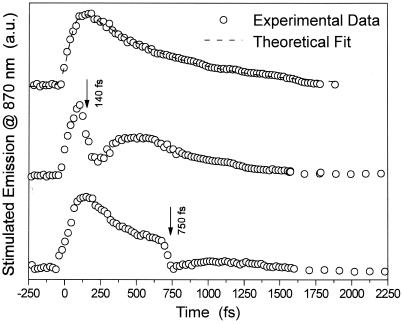
Figure 1.
The dependence of the relaxation of the stimulated emission from the lowest excited state (S) on the mode of their excitation. Open circles represent the time-resolved stimulated emission decay of the lowest excited state in bR measured at 870 nm. a.u., arbitrary units. Top curve represents the time-dependent intensity of the stimulated emission excited by one-pump excitation of the S0→S1 transition, whereas the rest of curves show the stimulated emission with the second excitation pulse after delay time of 140 or 750 fs as shown. The dashed line in the top curve represents the theoretical fit to simple one-pulse excitation and decay.

