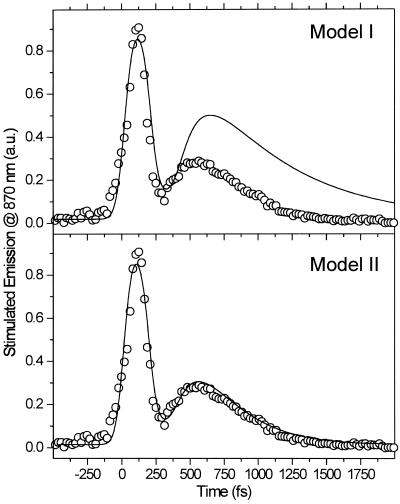
Figure 2.
Model fit (solid lines) to the experimental results (given by circles) of the two-pulse excitation experiments with a delay time of 240 ps. The fit in the upper curve is to model I, which assumes that the population resulting from both the direct (one-pulse) and indirect (two-pulse) excitation reach the same lowest excited state. The lower and better fit is for model II, which assumes that different excitations reach nearby states whose nonradiative relaxation rates are different (see Fig. 3 for details).

