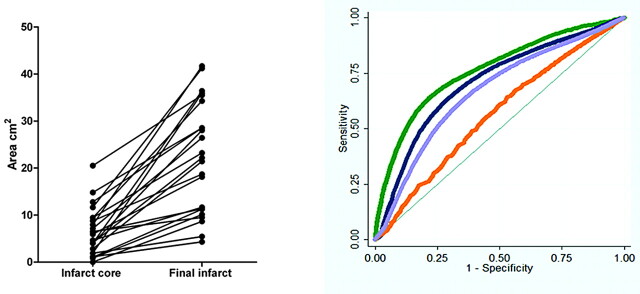
Fig 1.
Expansion of core infarct size (area of selected axial section) between the admission DWI scan and the coregistered follow-up CT or MR imaging was an inclusion criterion, and was present in all patients (left). Sample ROC curves (right) showing the sensitivity/specificity of different CTP parameter thresholds used to define “at-risk” penumbra destined to infarct, comparing maps processed by using standard software. Green curves represent rMTT; blue curves, rCBF; orange, rCBV; and purple, the rCBF*rCBV voxel product value maps.

