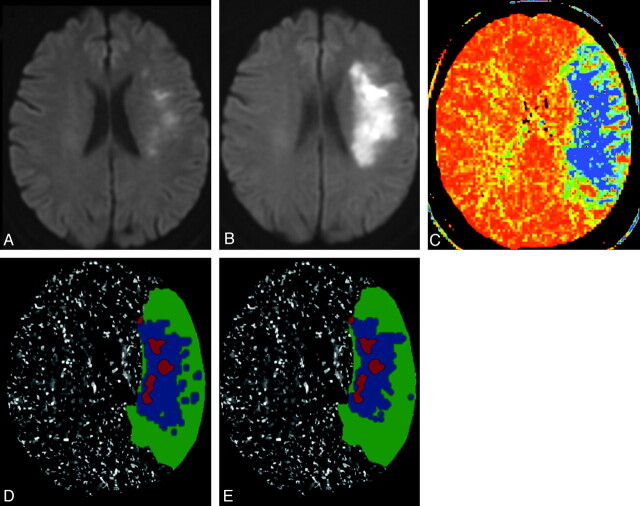
Fig 2.
Example of thresholded MTT map prediction of penumbra destined to infarct in a 70-year-old woman presenting with left hemispheric stroke symptoms. Ictus-to-CTP imaging time was 5 hours 33 minutes, admission NIHSS score was 6, and follow-up MR imaging was performed 44 hours after admission CTP scanning; NIHSS score was 12. Infarct core is segmented on the admission DWI scan (A, and red overlays on D, E), and final infarct volume is segmented on follow-up DWI scan (B). CT-MTT map shows blue/green regions with increased mean transit time (C). D and E, respectively, show the optimally thresholded absolute-MTT (12 seconds threshold) and relative-MTT (249% threshold) maps, both postprocessed by using standard algorithm, which distinguish benign oligemia (green overlays) from true “at-risk” ischemic penumbra (blue overlays).

