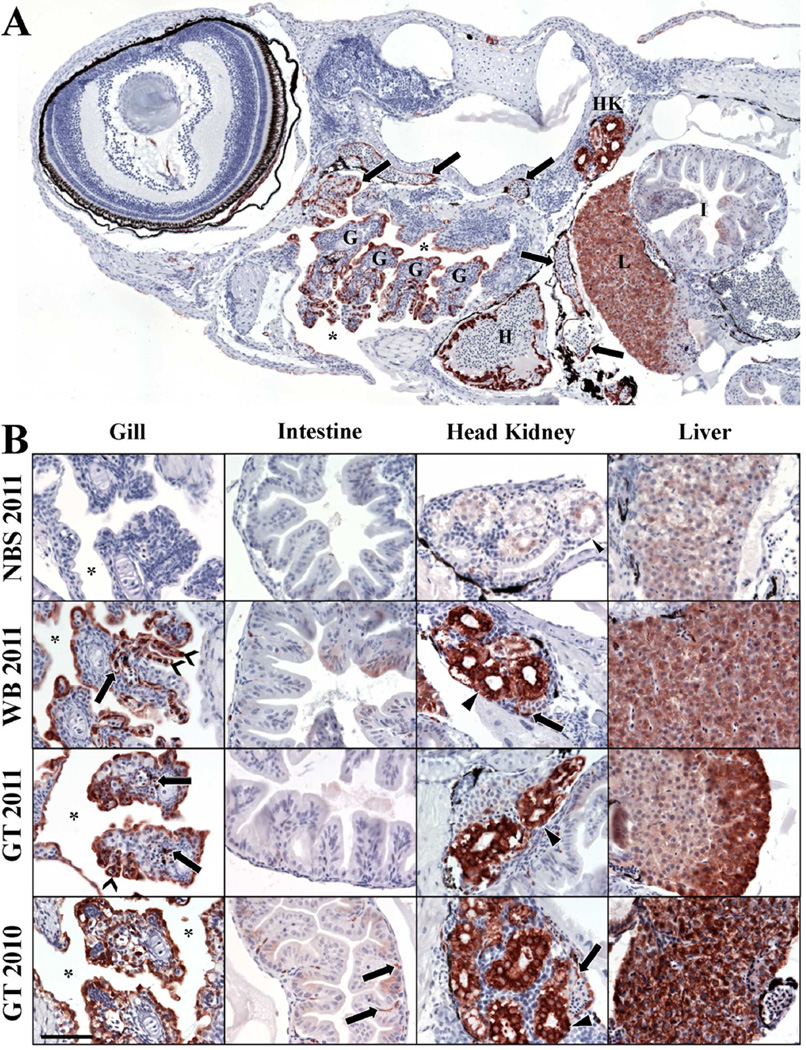
Figure 5.
A–B. Distribution of CYP1A protein (burgundy staining) in larval tissues at ≤ 24 h post hatch exposed throughout development to sediments collected from an unoiled reference location in North Bay Sansbois in 2011 (NBS 2011), from a mildly oiled location in Wilkinson Bay in 2011 (WB 2011), and a heavily oiled location at Grande Terre Island in 2010 and 2011 (GT 2011 and 2010). (A) Representative image of larvae at <24 hours post hatch that were exposed to WB sediment throughout embryonic development. CYP1A was mostly found localized in gill (G), intestine (I), head kidney (HK), liver (L), heart (H) endothelium, vascular endothelial cells (arrows), and in epithelial cells lining the buccopharyngeal cavity (asterisks) in fish exposed to oiled sediments (i.e. WB or GT sediments). Fish exposed to unoiled sediment from NBS showed staining for CYP1A in endothelia within the heart and kidney tubules (See supplementary data, S2). Larvae were sectioned at 4 µm. Figure depicts a montage of 12 images captured using a 20× objective. (B) Tissue sections from larvae at <24 hours post hatch. Gill tissues from fish exposed to WB 2011, GT 2011, and GT 2010 sediments had CYP1A-positive vascular endothelial cells and increased CYP1A in epithelial and pillar cells in the gill filaments and lamellae. Epithelial cells lining the buccopharyngeal cavity also showed increased CYP1A in these fish. Intestine showed light staining for CYP1A protein in the epithelial cells and endothelial cells in the submucosa in these fish. Head kidneys tubules and vascular endothelial cells in fish exposed to oiled sediment had higher CYP1A staining compared to fish exposed to unoiled NBS 2011 sediment. Hepatocytes of liver tissue of fish exposed to oiled sediments showed increased CYP1A expression compared to those of fish exposed to unoiled NBS sediment. Images captured through a 40× objective. Arrows = vascular endothelial cells, chevrons = gill lamellae, asterisks = bucopharyngeal cavity, arrow heads = kidney tubules. All tissues from A and B were sectioned at 4µm. Scale bar = 50µm. All slides were counterstained with hematoxylin (blue).

