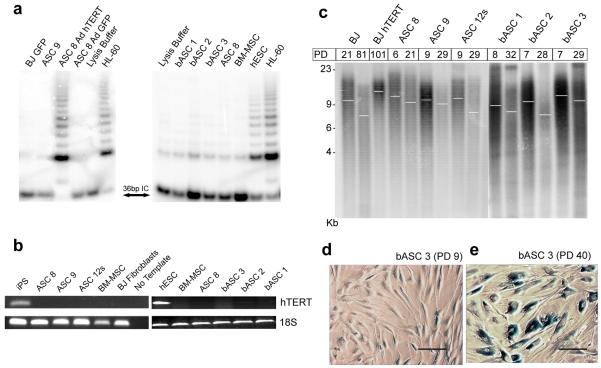
Figure 1. ASCs lack telomerase activity and exhibit telomere attrition with continued passage.
(a) Telomerase activity was assessed by TRAP for ASC populations isolated from different tissues (bASC denotes breast ASC). Significant activity is shown for Adenoviral hTERT-infected ASC 8. HL-60 and iPS cells served as positive controls. BJ-GFP and a lysis buffer-only samples were used as negative controls. IC denotes 36bp internal control used to standardize sample-to-sample variation. (b) Gel-based RT-PCR to detect levels of hTERT in iPS, ASC 8, ASC 9, ASC 12s, ESCs, bASC 1, bASC 2, bASC 3, BM-MSC, and BJ fibroblasts. 18S levels were tested and included as an internal control, while the negative control refers to no template added to the reaction. (c) A TRF to examine telomere lengths shows telomere erosion in ASC 8, ASC 9, ASC 12s, bASC 1, bASC 2, and bASC 3 with increased population doubling (PD), as indicated, with BJ fibroblasts at PD 21 and PD 81 as controls for telomere loss. BJ hTERT at PD 101 shows a more uniform telomere length with less heterogeneity for short telomeres. White bars indicate overall mean telomere length. Young bASCs (d) versus aged bASCs (e) express Senescence-Associated β-galactosidase (SA-β-gal) after long-term culture. Representative images for SA-β-gal staining are shown for bASC 3 at PD 9 and for bASC 3 after 40 PDs in culture. The scale bar in (d) and (e) indicates 100μc.

