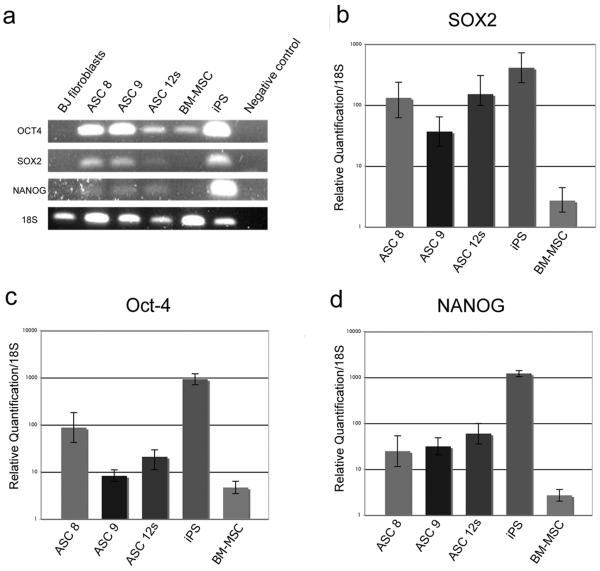
Figure 3. ASCs express significant levels of pluripotent stem cell markers.
(a) Gel-based RT-PCR for Oct-4, SOX2, NANOG, and 18S compared to controls shows detectable levels of each transcript for each isolated cell strain. (b–d) qRT-PCR of Oct-4, SOX2, and NANOG in ASCs is shown relative to expression in BJ fibroblasts (set as the baseline). Relative expression levels for (b) SOX2, (c) Oct-4, and (d) NANOG were assessed using 2-ΔΔCt method in ASCs, BM-MSC, and iPS. Data shown are relative to an endogenous control (18S RNA), with fold change compared to expression levels in BJ fibroblasts (set to 1). All lanes shown have a statistical significance of p<0.05 as compared to BJ fibroblasts using a student's T-test.

