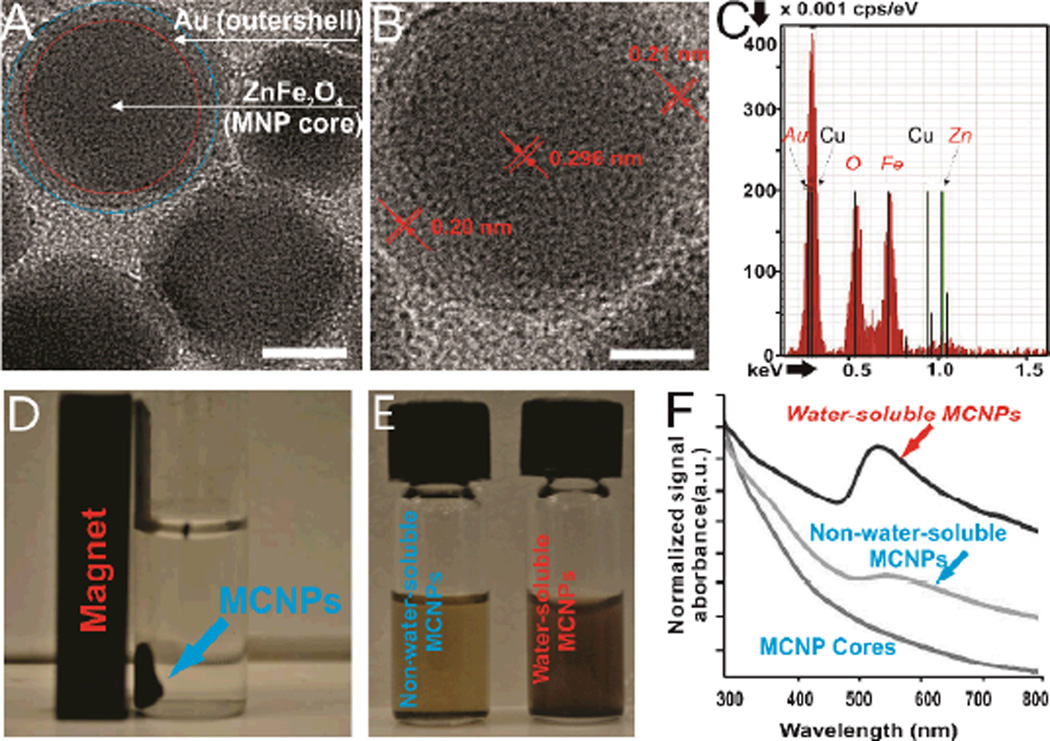
Figure 2.
A)TEM image of the MCNPs. Scale bar = 10 nm, B) HRTEM image of a single MCNP. Scale bar = 5 nm, C) EDAX spectra of individual MCNPs, D) Representative picture depicting that the MCNPs dispersed in water are attracted to a magnet. E) Representative picture of non-water-soluble and water-soluble MCNPs in solution. Please note that the light pink color of watersoluble MCNPs indicates the formation of a gold shell. F) UV-Vis absorption spectra of the MCNP cores, non-water-soluble MCNPs and water-soluble MCNPs. The cores and non-water-soluble MCNPs were dissolved in chloroform before UV-Vis analysis.

