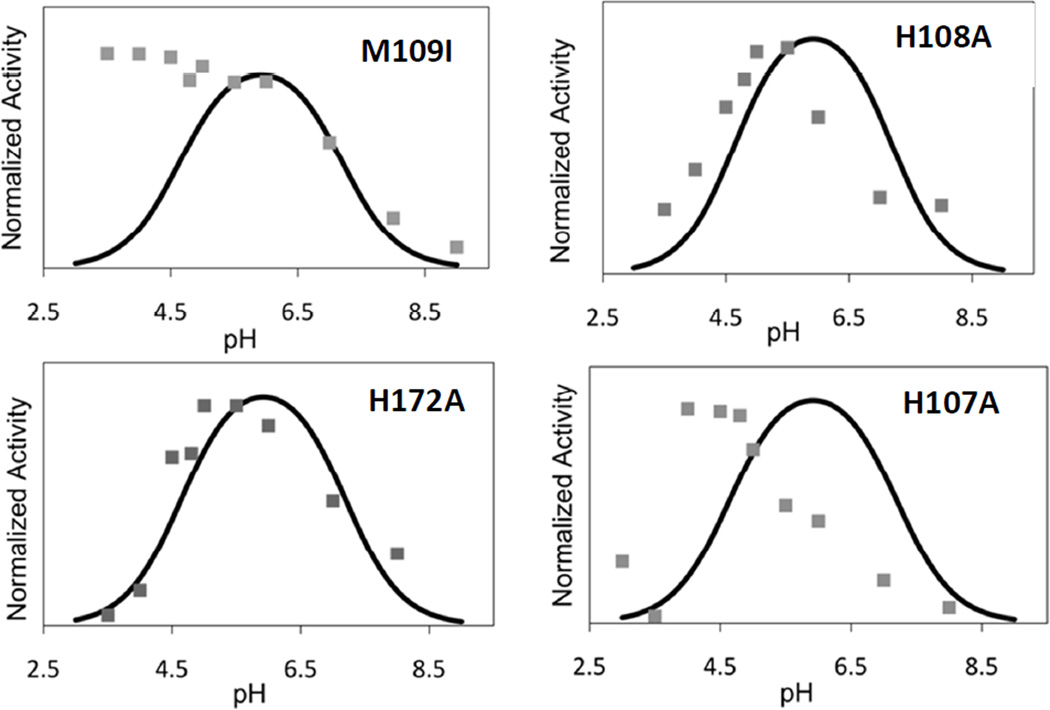
Figure 7.
pH-rate profiles for PHM H-site variants M109I, H108A, H172A and H107A. Rates were measured using the standard assay conditions at the different pHs as described in the text. To aid in comparison to the WT protein, all rate data have been normalized to unity, despite large differences in activity (as shown in Table 1). The solid trace in each panel is the simulated rate profile for the WT enzyme as determined in reference (27).

