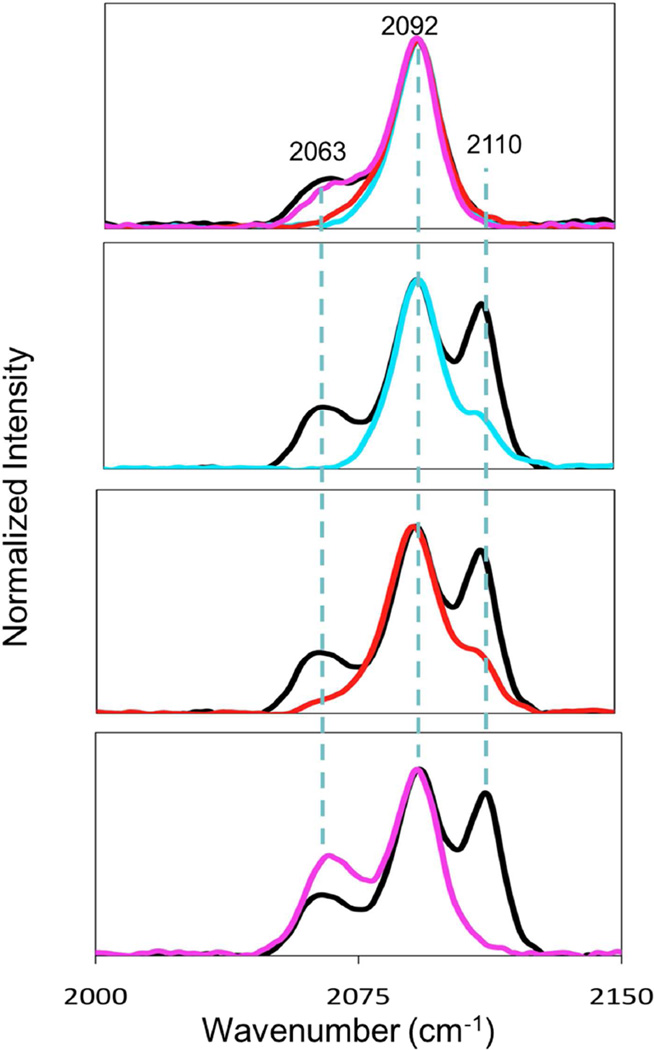
Figure 8.
FTIR spectra of the CO complexes of WT PHM and its H-site variants in the C≡O stretching region. (a) Comparison of IR spectra at pH 7.5 for WT (black), H107A (cyan), H108A (red) and M109I (magenta); (b) – (d) comparison of IR spectra at pH 3.5 for WT (black) and H107A (cyan) (panel (b)); WT (black) and H108A (red) (panel (c)); WT (black) and M109I (magenta) (panel (d)). Spectra are normalized to the intensity of the WT 2092 cm−1 band.

