Figure 3.

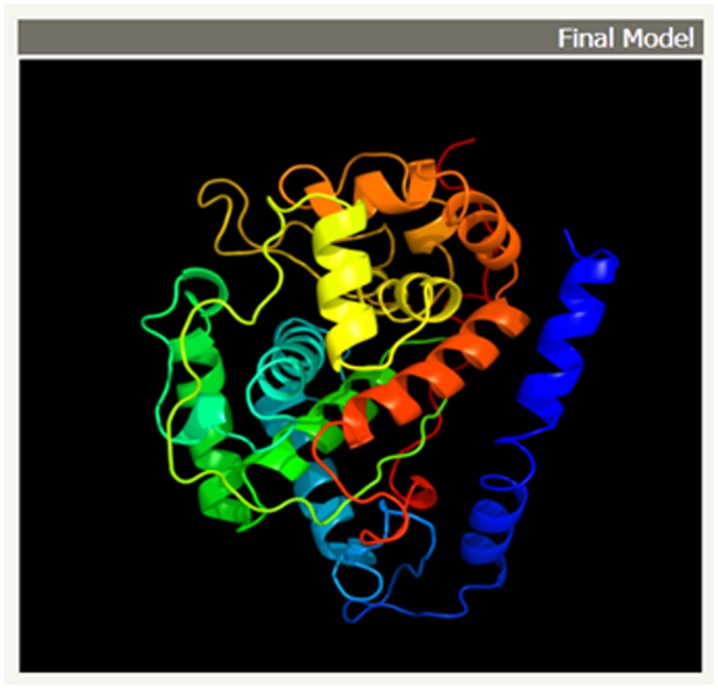
The final 3D structure of lignin peroxidase model from Macrophomina phaseolina. The α-helices and β –sheets are represented by redhelices and yellow ribbons respectively. This model was conducted by Phyre2 MODELLER program.

The final 3D structure of lignin peroxidase model from Macrophomina phaseolina. The α-helices and β –sheets are represented by redhelices and yellow ribbons respectively. This model was conducted by Phyre2 MODELLER program.