
Figure 3. Photomicrographs demonstrating p21WAF1/Cip expression.
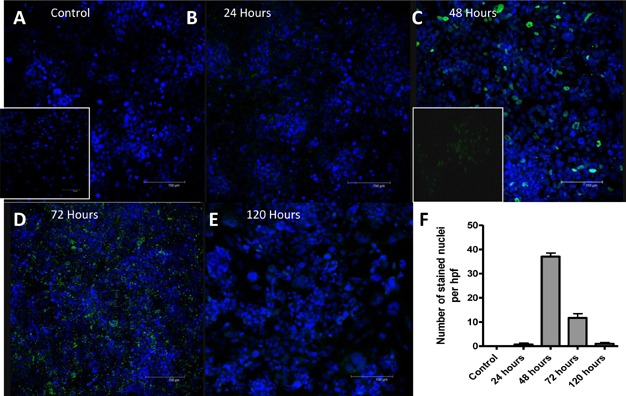
The nuclei of the Immortalized BEC are visualized with DAPI and are blue. p21WAF1/Cip is stained with FITC and is green. Panels A, B, C, D, and E show results observed at time 0, 24, 48, 72, and 120 h, respectively. The increase in nuclear p21WAF1/Cip staining is seen with a peak at 48 h. Staining seen at 72 h is largely cytoplasmic, indicating phosphorylated and therefore inactive p21WAF1/Cip. The nuclear staining is shown graphically in panel F, three representative fields from three separate experiments at each time point. Primary BEC were also stained, images are shown inset for control (inset A) and at 48 h (inset C).