
Figure 4.
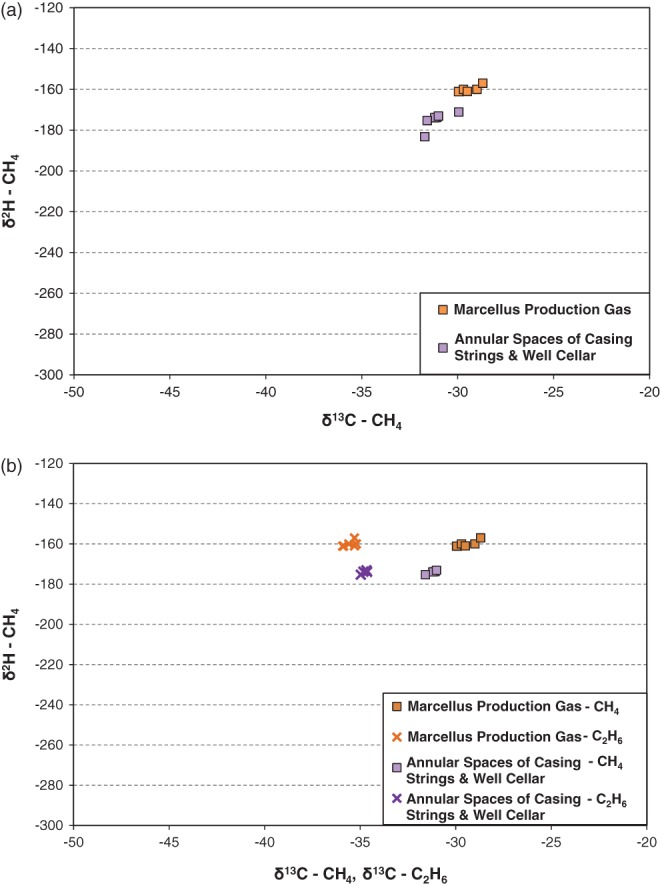
(a) Schoell plot of gases sampled by the Pennsylvania DEP and Cabot from production casing/production pipelines, the annular spaces of casing strings, and the well cellar of gas wells in the Dimock Township. (b) Plot of δ13C values of methane and ethane (x-axis) vs. δ2H value of methane (y-axis) in gases sampled by the Pennsylvania DEP and Cabot from production casing/production pipelines, the annular spaces of casing strings, and the well cellar of gas wells in the Dimock Township. *Only samples with reported values of both δ13C-CH4 and δ13C-C2H6 are shown.