Figure 3.

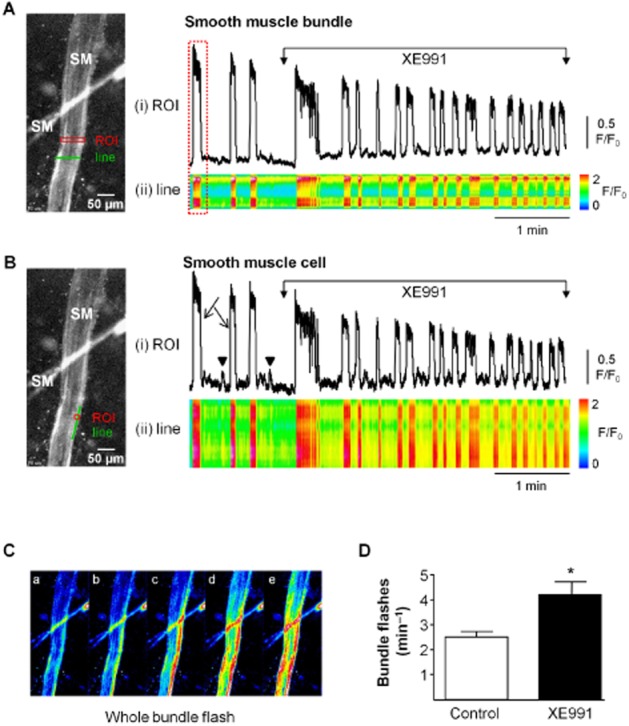
The effect of XE991 on calcium oscillations in SMC within tissue sheets. (A) Bladder tissue preparation loaded with the calcium indicator Fluo-4AM showing 2 smooth muscle bundles (SM). Activity was analysed with a region of interest (ROI) and a line drawn across the bundle. (i) Intensity–time plot of activity in the ROI showing XE991-induced (10 μM) enhancement in the frequency of whole bundle calcium flashes. (ii) Post hoc x-t analysis of fluorescence intensity demonstrates occurrence of the flashes across the width of the bundle. (B) (i) ROI analysis of the smooth muscle cell at the edge of the bundle as indicated on the micrograph showing that activity within a single smooth muscle cell is augmented by XE991. Large Ca2+-transients (arrow) occurred along the length of the cell, as shown in the line analysis below (ii). Smaller, localized Ca2+ events did not propagate along the cell length (arrowhead). Both types of Ca2+ signals were increased by XE991. (C) Consecutive frames from the whole bundle flash highlighted in A show the spread of Ca2+ signal across the bundle from right to left. (D) Summary bar chart of the significant increase in the frequency of smooth muscle bundle flashes by XE991. Control bar refers to pre-drug spontaneous activity. *P < 0.05, significantly different from control: n = 5.
