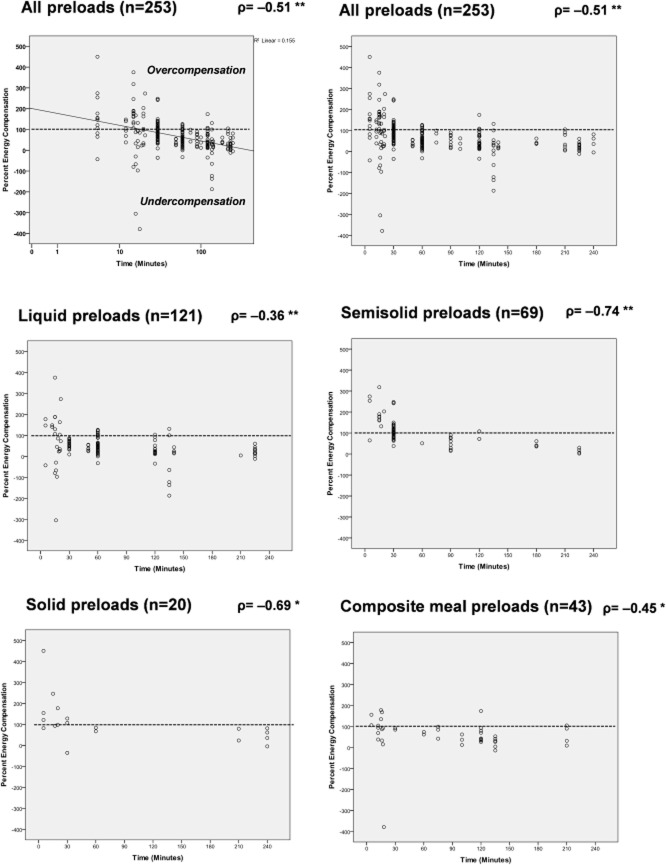
Figure 2. Distribution of %EC values in preload studies (n = 253) employing liquid, semisolid, solid, and composite (a solid or semisolid plus a beverage) meal preloads, for intermeal intervals between 5 and 240 min.
The Spearman's rho coefficient is indicated. Y-axis values of 100% indicate perfect compensation (dotted line). Values <100% indicate undercompensation, with values <0% indicating consumption of additional energy beyond the preload energy content (i.e., “overeating”). Values above 100% indicate the preload suppressed subsequent intake to an extent greater than the energy content of the preload (i.e., “overcompensation”). Percent energy compensation is graphed against the Log(Time) on the first graph to improve the fit of the linear regression line. Log(Time) is not used in the other examples to facilitate interpretation of the IMI. * Significant correlation at the p < 0.01 level; ** p < 0.001.

