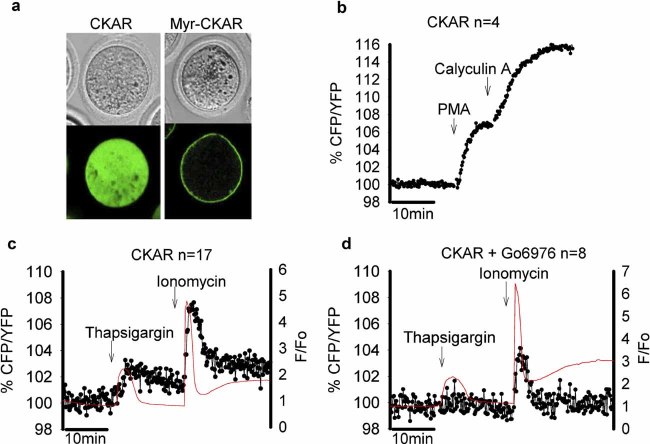
Fig. 1.
Monitoring PKC activation in mouse eggs with CKAR probes. a: Bright field (top) and confocal fluorescence (lower) images of eggs expressing cytosolic CKAR and plasma membrane-targeted MyrPalm-CKAR. In (b) the % change in CKAR FRET signal (CFP/YFP) is shown for a representative egg in response to the addition of PMA (200 nM) and calyculin A (100 nM). In (c) the CKAR ratio (black circles and lines) is plotted alongside the Ca2+ levels (red line) which are expressed as a ratio of Rhod-dextran fluorescence over the starting fluorescence level in eggs. Responses are shown from typical eggs in response to thapsigargin (20 µM) and then ionomycin (5 µM). In (d) the conditions are the same as in (c) but the egg was incubated in the presence of conventional PKCs inhibitor Gö6976 (10 µM) before the addition of thapsigargin and ionomycin. The “n” numbers refer to the total number of eggs examined for each experiment type. [Color figure can be seen in the online version of this article, available at http://wileyonlinelibrary.com/journal/jcp]

