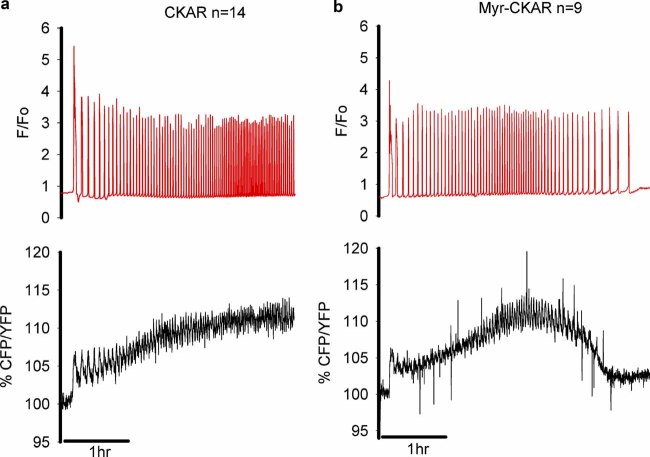
Fig. 4.
CKAR phosphorylation with high frequency Ca2+ oscillations. Eggs expressing (a) CKAR (n = 14) or (b) MyrPalm-CKAR (n = 9) were microinjected with a high dose of PLCζ (0.1 µg/µl pipette concentration) to trigger high frequency Ca2+ oscillations. The plots are in the same format as Figure 1 with Ca2+ as a red line and CKAR ratios as black lines. [Color figure can be seen in the online version of this article, available at http://wileyonlinelibrary.com/journal/jcp]

