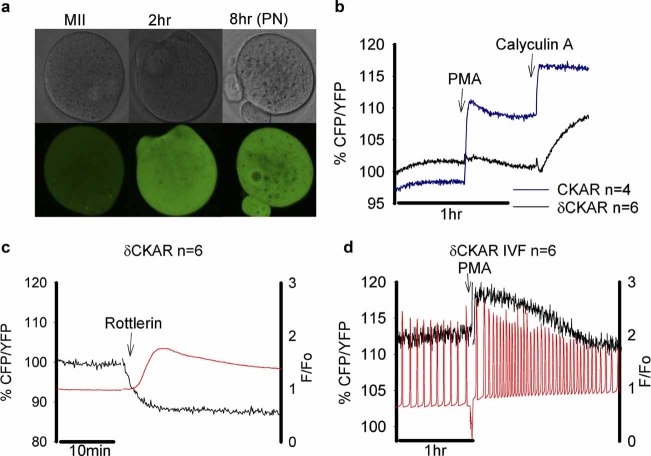
Fig. 5.
The δCKAR FRET signal and Ca2+ changes in mouse eggs. In (a) bright field and confocal images of eggs expressing δCKAR in unfertilized eggs, 2 h and 8 h (PN-pronucleus) after PLCζ injection. In (b) the CKAR response (blue line) and δCKAR response (solid line) are shown in an unfertilized mouse egg in response to 200 nM PMA and then 100 nM calyculin A. In (c) the δCKAR and Ca2+ response in an unfertilized egg is shown upon addition of rottlerin (2 µM). In (d) Ca2+ oscillations are shown in an egg (in red) at fertilization and the δCKAR signal is plotted (superimposed in black). Arrow shows the time, at which PMA (200 nM) was added. Sample traces are shown and the “n” numbers indicate the total number of eggs. [Color figure can be seen in the online version of this article, available at http://wileyonlinelibrary.com/journal/jcp]

