FIGURE 3.

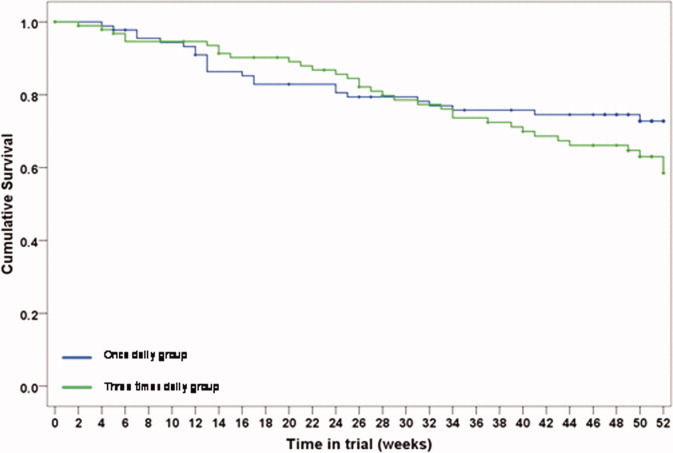
Remission rate in the once daily group (blue line) versus the TDS group (green line). P = 0.211 (log rank, Mantel-Cox). [Color figure can be viewed in the online issue, which is available at wileyonlinelibrary.com.]

Remission rate in the once daily group (blue line) versus the TDS group (green line). P = 0.211 (log rank, Mantel-Cox). [Color figure can be viewed in the online issue, which is available at wileyonlinelibrary.com.]