
FIGURE 3.
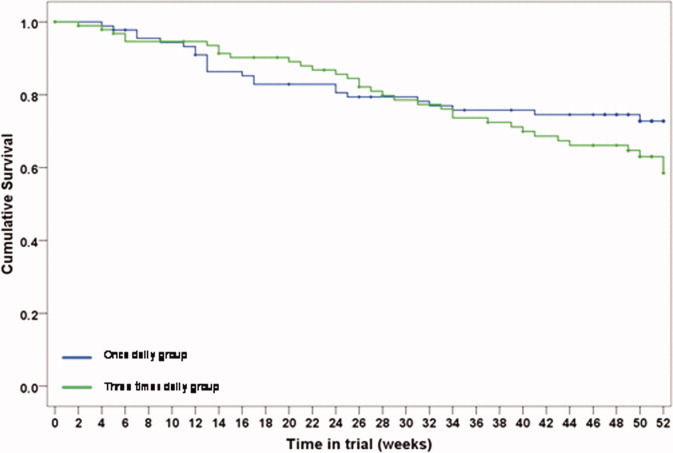
Remission rate in the once daily group (blue line) versus the TDS group (green line). P = 0.211 (log rank, Mantel-Cox). [Color figure can be viewed in the online issue, which is available at wileyonlinelibrary.com.]
Official websites use .gov
A
.gov website belongs to an official
government organization in the United States.
Secure .gov websites use HTTPS
A lock (
) or https:// means you've safely
connected to the .gov website. Share sensitive
information only on official, secure websites.
Remission rate in the once daily group (blue line) versus the TDS group (green line). P = 0.211 (log rank, Mantel-Cox). [Color figure can be viewed in the online issue, which is available at wileyonlinelibrary.com.]