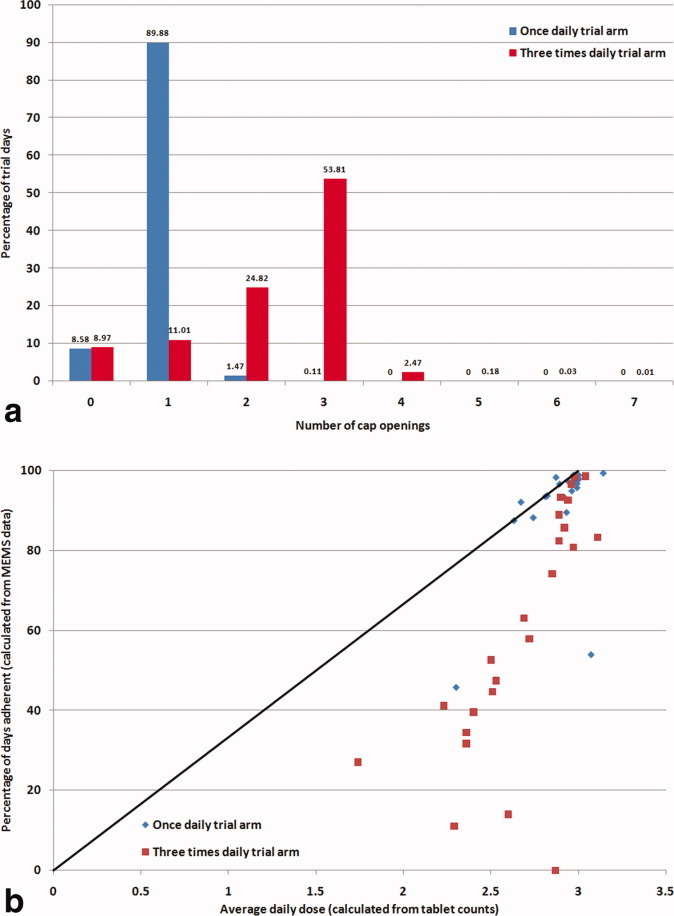
FIGURE 4.

(a) Frequency plot of number of cap openings in 1 day during trial (substudy population, ITT group). (b) Percentage days adherent as measured by MEMS data, plotted against mean daily tablets taken measured by tablet count. Line represents equivalence (substudy population, ITT group). [Color figure can be viewed in the online issue, which is available at wileyonlinelibrary.com.]
