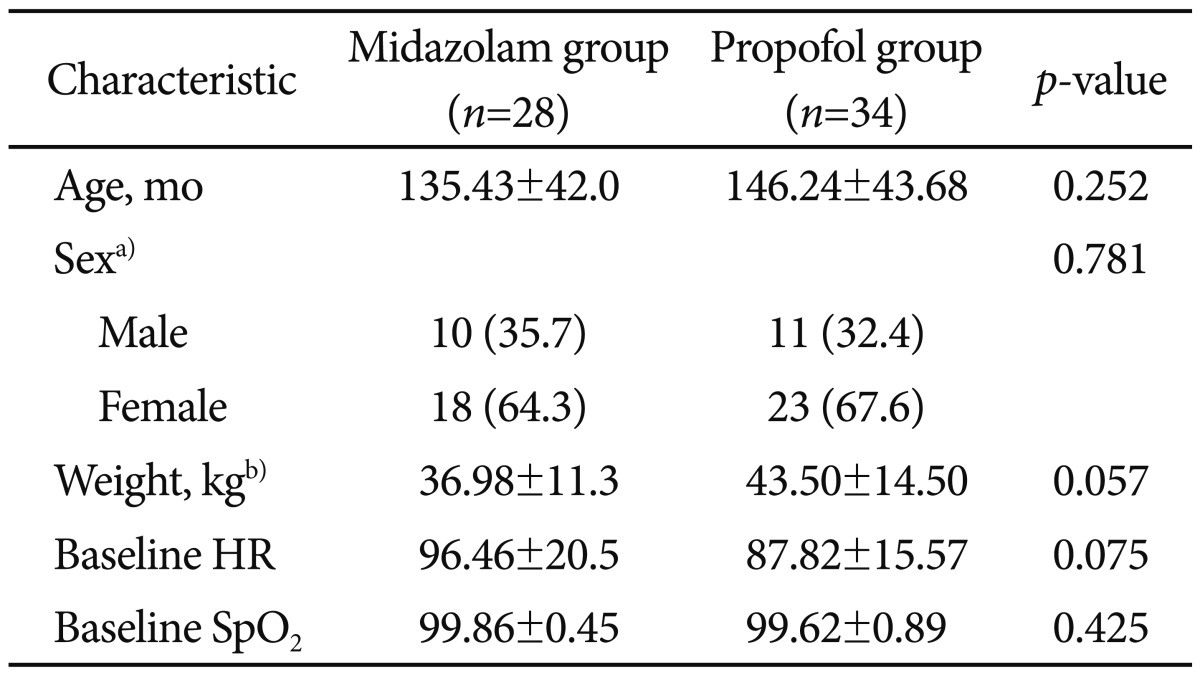
Table 2.
Patients' Characteristics

Values are presented as mean±SD or number (%). Unmarked were Mann-Whitney U test.
HR, heart rate.
a)Unpaired Student t-test; b)Chi-square test.
Patients' Characteristics

Values are presented as mean±SD or number (%). Unmarked were Mann-Whitney U test.
HR, heart rate.
a)Unpaired Student t-test; b)Chi-square test.