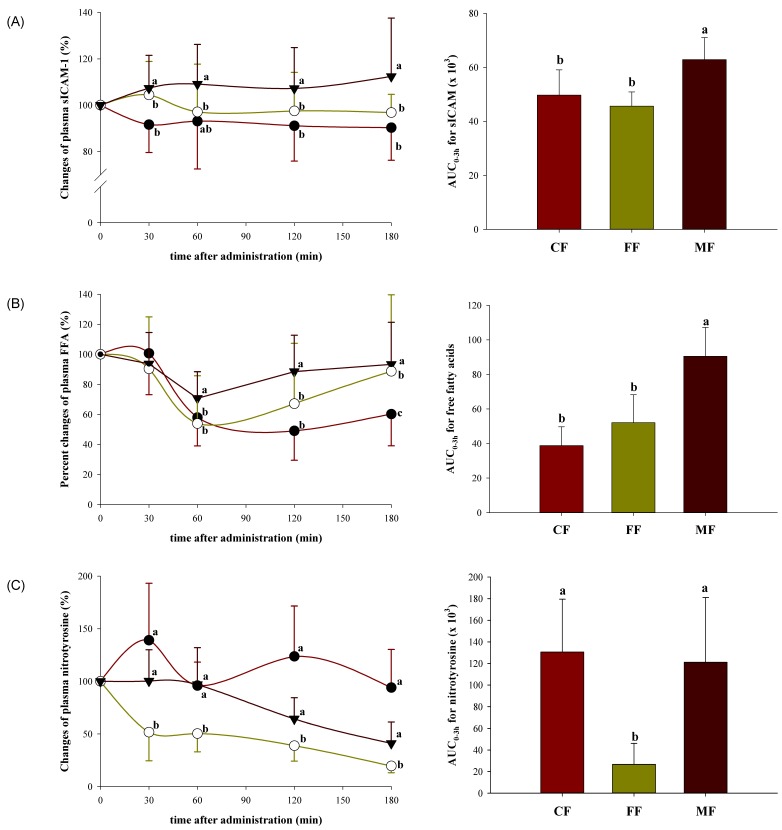
Fig. 2.
Postprandial plasma sICAM-1 (A), NT (B), and FFA (C) responses in non-diabetic subjects (n = 8/group) to a control dietary formula (CF, ●), a high-fiber dietary formula (FF, ○), and a high-MUFA dietary formula (MF, ▼), standardized to 50 g available glucose. Data are represented as percentages of the baseline concentration, and curves represent changes in plasma levels for 180 min following the ingestion of a dietary formula. The corresponding AUC was calculated using the trapezoidal method. Data points (mean ± SD) and bars with different superscripts are significantly different (P < 0.05) by ANOVA with the post-hoc Bonferroni multiple comparison tests.

