
Table 5.
Distribution of bone mineral density according to dairy equivalent of calcium (N(%))
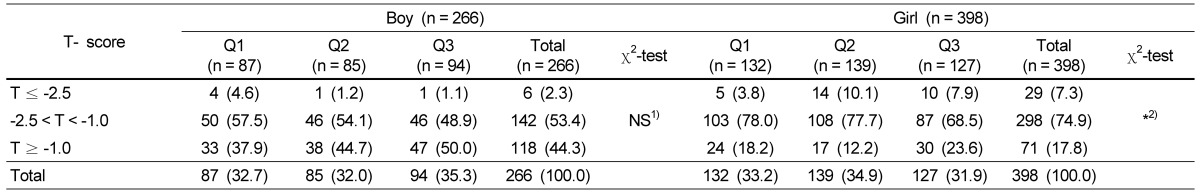
1)NS, not significant
2)Significant at α = 0.05 by χ2-test
T ≤ -2.5: osteoporosis, -2.5 < T < -1.0 osteopenia, T ≥ -1.0: normal
Official websites use .gov
A
.gov website belongs to an official
government organization in the United States.
Secure .gov websites use HTTPS
A lock (
) or https:// means you've safely
connected to the .gov website. Share sensitive
information only on official, secure websites.
Distribution of bone mineral density according to dairy equivalent of calcium (N(%))
1)NS, not significant
2)Significant at α = 0.05 by χ2-test
T ≤ -2.5: osteoporosis, -2.5 < T < -1.0 osteopenia, T ≥ -1.0: normal