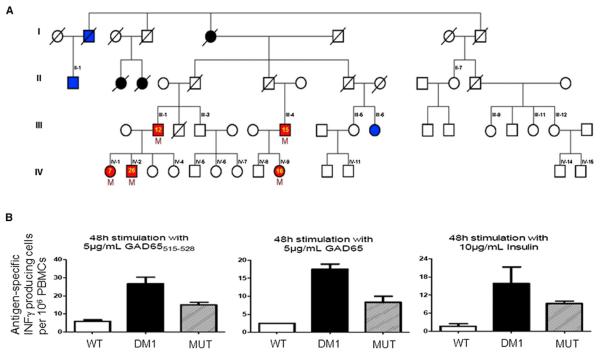
Figure 1. The Patients' Family Tree and Functional Analysis of Peripheral Blood Mononuclear Cells.
(A) Red symbols indicate family members who developed an autoimmune disease: type 1 diabetes (III-1, III-4, IV-1, IV-2) or colitis (IV-9). The yellow numbered symbols denote the age of onset of the disease. Blue symbols indicate type 2 diabetes, while black symbols indicate an unclear diabetes phenotype. Black numbered symbols identify all family members who were tested for the presence of the mutation, and the letter “M” identifies the ones who were positive. A slash denotes deceased family members. Individuals IV-1 to IV 15, III-1, III-4, III-5, III-9, III-11, and III-12 are lean (body mass index <25 Kg/m2), and II-1 and III-6 have body mass indices of 27 and >40 Kg/m2, respectively.
(B) Peripheral blood mononuclear cells were obtained from healthy control subjects (WT) and from patients with type 1 diabetes carrying wild-type SIRT1 (DM1) or the L107P mutation (MUT). GAD65515–528 peptide, whole GAD65 protein, and insulin elicited antigen-specific IFN-γ production. n = 3 for each of the three groups. All data are presented as mean ± SEM.

