Figure 1.
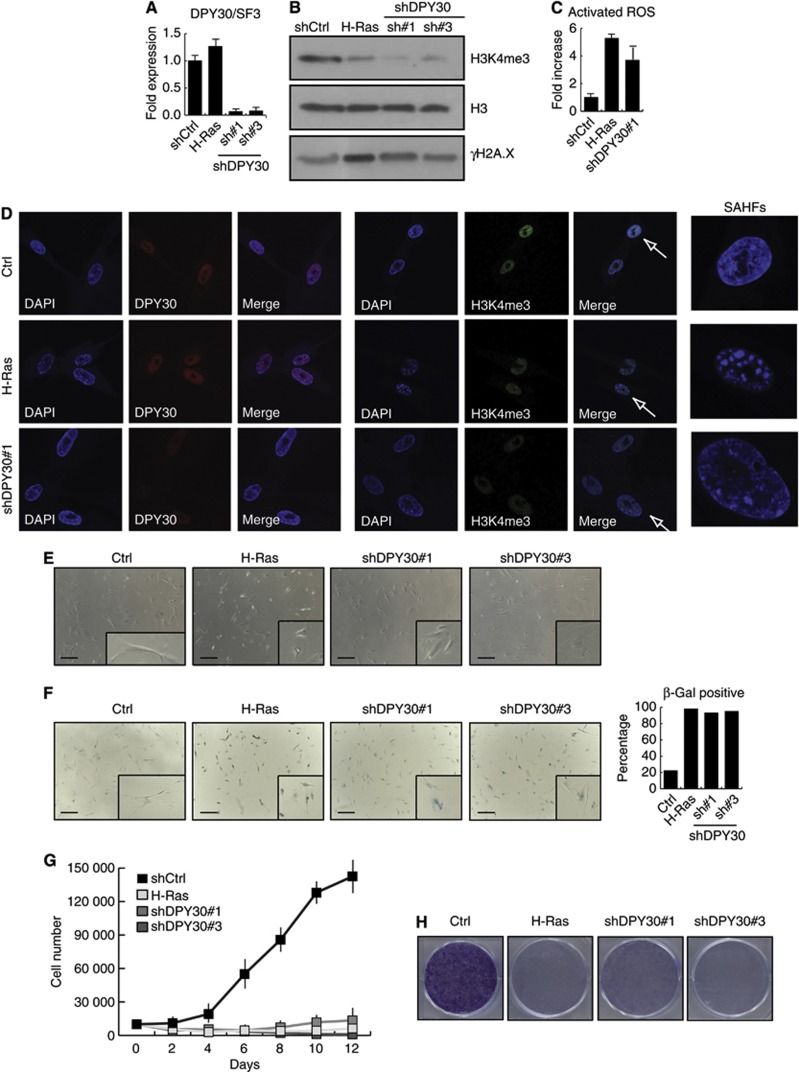
Loss of DPY30 leads to senescence-like phenotype. (A) Stable depletion of DPY30 in IMR90 human fibroblasts. mRNA expression levels of DPY30 were monitored by RT–PCR 6 days after selection in IMR90 control cells (shCtrl), those expressing oncogenic H-Ras, and those interfered for DPY30 using two different short-hairpin constructs (DPY30 sh#1 and sh#3). Expression of DPY30 was normalized to the housekeeping gene SF3B2 (SF3) and is shown relative to the IMR90 control cells as fold-reduction. These cell lines were used for the assays in this figure 6 days after selection. (B) H3K4me3 levels are reduced, while γH2A.X levels are increased, in IMR90 cells interfered for DPY30. Acid-extracted histones from control (shCtrl), senescent (H-Ras), and DPY30-depleted (DPY30 sh#1 and sh#3) IMR90 cells (6 days after selection) were separated by SDS–PAGE and analysed by western blot for H3K4me3 and γH2A.X. An antibody against total histone H3 was used to ensure equal loading. (C) Total ROS activity is increased in shDPY30 IMR90 cells. Total ROS activity was determined in control (shCtrl), H-Ras expressing and DPY30-depleted (shDPY30 sh#1) IMR90 by flow cytometry and is illustrated as fold-increase relative to control cells (n=3). (D) Immunofluorescence for DPY30 and H3K4me3 in control (Ctrl), senescent (H-Ras), and DPY30-depleted (DPY30 sh#1) cells. SAHFs in senescent and DPY30-depleted cells were stained by DAPI. (E) Morphological changes upon interference of DPY30. Pictures were taken by optical microscopy. Scale bar corresponds to 325 μm. A flattened morphology typical for senescence is observed for the IMR90 cells expressing H-Ras (as expected) as well as for the DPY30-depleted cells (DPY30 sh#1 and sh#3). (F) SA-β-galactosidase assay performed with control (Ctrl), IMR90 expressing H-Ras or DPY30-depleted (shDPY30#1 and #3) IMR90 cells. For quantification, 600 cells of each cell line were counted. The scale bar corresponds to 325 μm. (G) DPY30-depleted fibroblasts stop proliferating. Growth curves of control IMR90 (Ctrl), IMR90 expressing H-Ras, and IMR90 interfered for DPY30 (shDPY30#1 and #3) were generated by seeding 10 000 cells on day 0 after selection; the cell number was counted every second day (n=3). (H) Colony formation assay of control IMR90 (Ctrl), IMR90 expressing H-Ras, and IMR90 interfered for DPY30 (shDPY30#1 and #3) was performed by seeding 20 000 cells on day 0 after selection. After 7 days, the colonies were stained with crystal violet.
Source data for this figure is available on the online supplementary information page.

