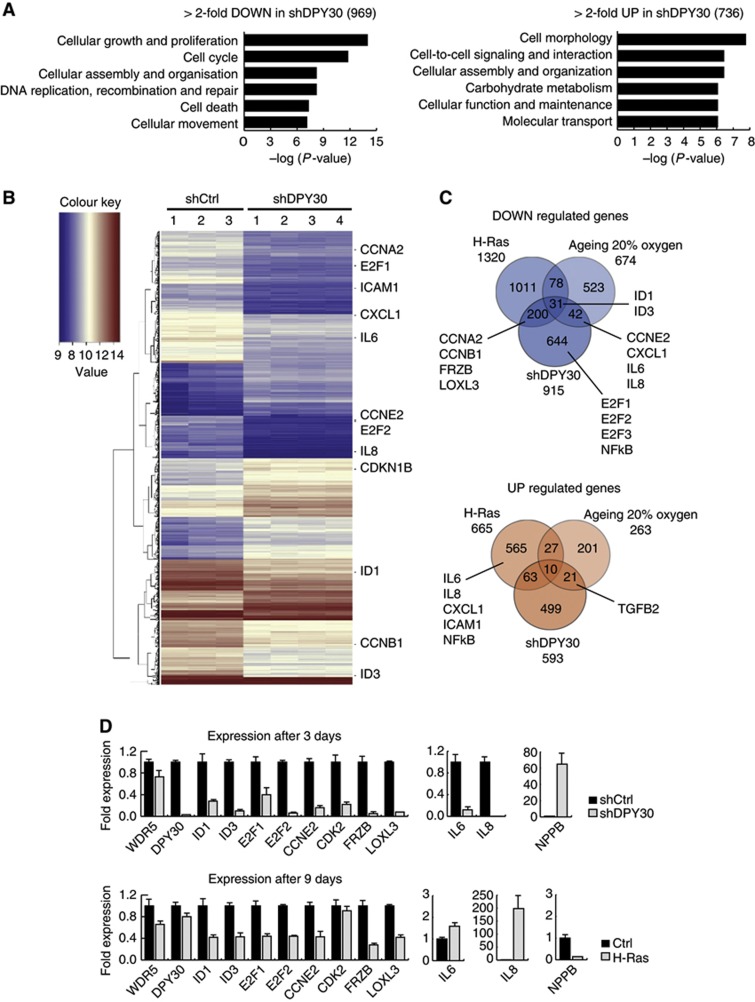
Figure 3.
Microarray expression analyses of control and DPY30-depleted IMR90 cells, as compared to oncogene-induced and replicative senescence. (A) Gene ontology (GO) of >2-fold deregulated genes with a P-value of <0.05 in IMR90 cells depleted of DPY30 (shDPY30) 3 days after selection. In total, 969 genes were downregulated and 736 were upregulated. (B) Heatmap of genes deregulated >2-fold with a P-value of <0.05. Three biological replicates of IMR90 control cells (shCtrl), and four biological replicates of IMR90 DPY30 knockdown cells (shDPY30), were used for RNA extraction and array hybridization. Several genes involved in cell cycle and cytokine signalling are highlighted within the heatmap. (C) Venn diagram of overlapping deregulated genes in H-Ras-induced senescent IMR90 cells (H-Ras; Affymetrix), replicative senescent IMR90 cells grown under atmospheric conditions (ageing 20% oxygen; Affymetrix), and senescent IMR90 cells induced by knockdown of DPY30 (shDPY30; Agilent). Only genes common on both arrays were taken into account. Several genes involved in cell cycle and cytokine signalling are highlighted. (D) Verification of microarray expression analysis by RT–PCR. Samples were taken 3 days after selection for DPY30 knockdown, and 9 days after selection for H-Ras-expressing, IMR90 cells. Changes in gene expression were verified for several genes, which were mainly downregulated in DPY30 knockdown cells. Absolute expression values were normalized to the housekeeping gene SF3B2 (SF3) and are shown relative to the expression level in control IMR90 (shCtrl) cells, which was set to 1 (n=2).

