Figure 4.
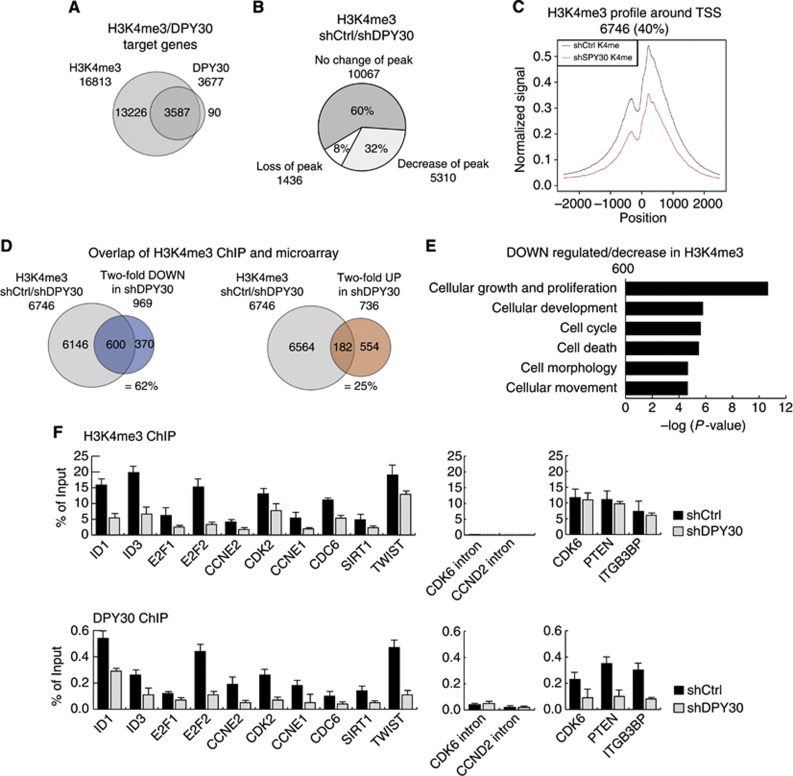
Global ChIP sequencing analysis of DPY30 and H3K4me3. (A) ChIPseq was performed for H3K4me3 and DPY30 in IMR90 control cells (shCtrl) 3 days after selection. The Venn diagram shows the overlap of genes that are trimethylated on H3K4 (H3K4me3) and bound by DPY30. (B) ChIPseq for H3K4me3 performed in DPY30-depleted IMR90 cells, 3 days after selection (shDPY30). H3K4me3 peak intensities were quantitatively compared for target genes in shCtrl and shDPY30 cells. The Pie chart represents a group of genes with trimethylated H3K4 (H3K4me3) in both, shCtrl and shDPY30 cells (60%), as well as genes with either loss (8%) or strong reduction (32%) in H3K4me3 peaks upon knockdown of DPY30. (C) Composite profiling of H3K4me3 peaks 2.5 kb upstream and downstream of the TSS of target genes that showed loss or a significant reduction in H3K4me3 levels in DPY30 knockdown IMR90 cells (red line). (D) Overlap of ChIPseq and expression array. The Venn diagrams show the overlap of genes with decreased H3K4me3 and those with >2-fold downregulation (=62%) or upregulation (=25%) in DPY30 knockdown IMR90 cells. (E) Gene ontology (GO) of genes with decreased H3K4me3 that were downregulated by >2-fold in DPY30 knockdown IMR90 cells. (F) Verification of ChIPseq. H3K4me3 levels and DPY30 binding were monitored on several candidate genes by RT–PCR. Three genes that revealed conserved H3K4me3 levels as well as intronic regions were included as negative controls. Values are represented as percentage of input (n=2).

