Figure 5.
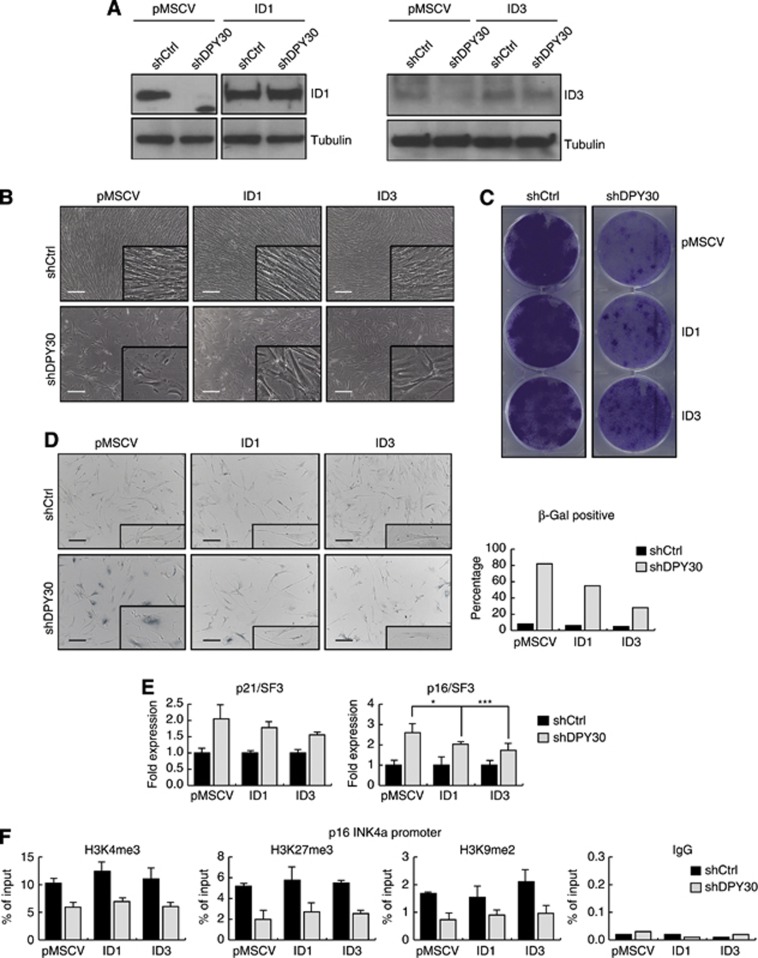
Ectopic expression of ID proteins partially rescues the senescence-like phenotype induced by loss of DPY30. (A) Ectopic overexpression of ID1 and ID3 in IMR90. IMR90 cells were infected with plasmids expressing empty pMSCV or pMSCV-ID1 (ID1) or pMSCV-ID3 (ID3). After selection, these cells were infected with a control hairpin (shCtrl) or with a hairpin to stably knockdown DPY30 (shDPY30). After the second selection, the expression levels of ID proteins were monitored by western blot using whole cell extracts. Tubulin was used to ensure equal loading. (B) Ectopic expression of ID1 and ID3 partially rescues the growth defect and morphological changes induced by loss of DPY30 (18 days after the second infection). Images were taken by optical microscopy. Scale bar corresponds to 325 μm. (C) Colony formation assay of control (shCtrl) and DPY30 knockdown (shDPY30) IMR90 cells, either not expressing (pMSCV) or expressing ID1 or ID3. About 20 000 cells were seeded on day 0 after the second selection. After 24 days, the colonies were stained with crystal violet. (D) SA-β-galactosidase assay was performed with control (shCtrl) and DPY30 knockdown (shDPY30) IMR90 cells that expressed ID1 or ID3, as indicated. Cells were seeded 18 days after the second selection and fixed for the assay 2 days later. For quantification, 400 cells of each cell line were counted. (E) Ectopic expression of ID1 and ID3 partially rescues the induced expression of p16INK4a by loss of DPY30. Eighteen days after selection, expression of p21CIP1WAF1 (p21) and p16INK4a (p16) was monitored by RT–PCR. Overexpression of the ID proteins resulted in a reduced induction of p21, which was not significant (ID1, P-value=0.3; ID3, P-value=0.1; Student’s t-test) and p16, which was significant in both cases (ID1, *P-value=0.06; ID3, ***P-value=0.01; Student’s t-test). Absolute expression values were normalized to the housekeeping gene SF3B2 (SF3) and are shown relative to the expression level in control IMR90 (pMSCV/shCtrl) cells as fold expression (n=5). (F) Chromatin immunoprecipitation (ChIP) in control (shCtrl) and DPY30 knockdown (shDPY30) cells, either not expressing (pMSCV) or expressing ID1 or ID3 18 days after the second infection. H3K4me3, H3K27me3, and H3K9me2 were monitored at the p16INK4a promoter region. The histone modifications were normalized to histone H3. An unspecific IgG antibody was included as a negative control. Values are presented as percentage of input (n=3).
Source data for this figure is available on the online supplementary information page.

