Figure 2.
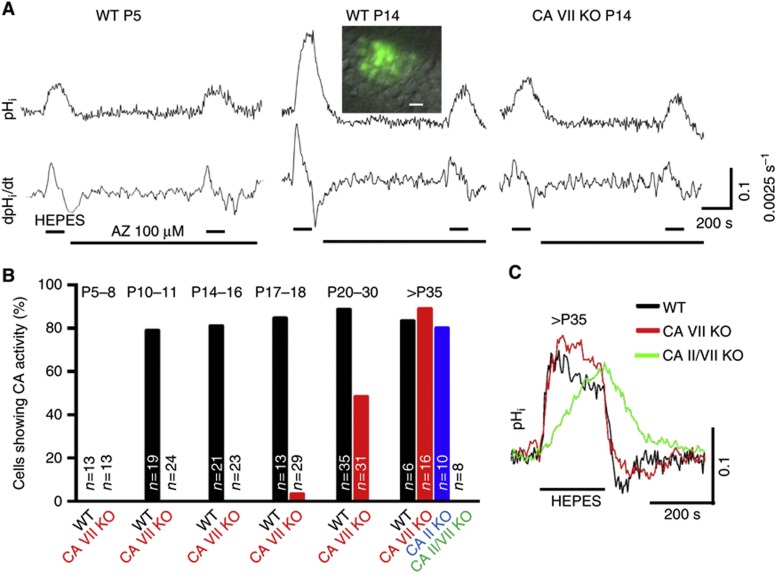
Development of cytosolic CA activity in mouse CA1 pyramidal neurons is based on sequential expression of isoforms VII and II. (A) Original single-cell pHi traces and their time derivatives from P5 and P14 WT and P14 CA VII KO neurons (baseline pHi 7.21, 7.13 and 7.11, respectively). Superfusion with CO2/HCO3−-free HEPES solution (upper horizontal bars) evoked an intracellular alkalinization, which in P14 WT was large and suppressed by 100 μM acetazolamide (AZ, lower horizontal bar), indicating the presence of CA activity (see Supplementary Materials and methods). The possible effect of AZ on extracellular CAs was excluded by adding 10 μM benzolamide (a poorly permeant CA inhibitor). Inset shows an overlay of the BCECF fluorescence signal and Dodt gradient contrast image of CA1 pyramidal neurons in P14 WT (scale bar 10 μm). (B) Summary of the results obtained using the cytosolic CA activity detection method shown in A and quantified as the percentage of cells showing cytosolic CA activity. Data from CA II KO and CA II/VII KO neurons were obtained only at >P35. The number of cells tested is indicated for each bar. The animal numbers for WT mice at the different age points was n=3 (P5–8), n=2 (P10–11), n=3 (P14–16), n=2 (P17–18), n=2 (P20–30) and n=2 (>P35); for CA VII KO mice the numbers were n=3 (P5–8), n=2 (P10–11), n=5 (P14–16), n=3 (P17–18), n=4 (P20–30) and n=2 (>P35); and for CA II KO and CA II/CA VII KO mice the number was n=2 (>P35). (C) Typical single pyramidal neuron pHi responses evoked by withdrawal of CO2/HCO3− (horizontal bar, HEPES) in slices from >P35 WT, CA VII KO and CA II/VII KO mice. The rate of rise and the amplitude of the alkaline shift are identical in WT (P39, baseline pHi 7.01) and CA VII KO neurons (P40, 7.06), whereas alkalinization develops much more slowly in the CA II/VII KO (P46, 7.04).

