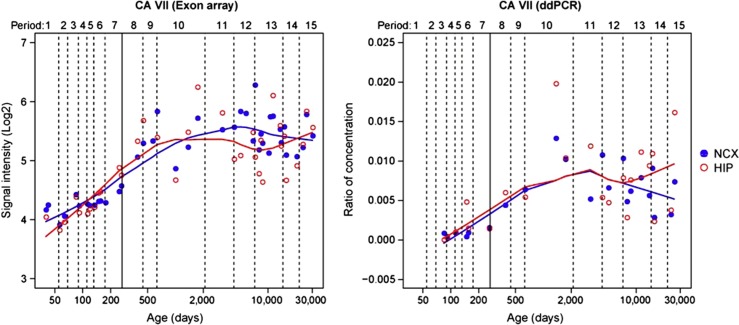
Figure 6.
CA VII expression during human brain development. Line plots show the log2-transformed exon array signal intensity (left), and the normalized ratio of absolute copy number of CA VII to Gapdh by droplet digital PCR (ddPCR, right) in the neocortex (NCX) and hippocampus (HIP) from the early fetal period to late adulthood. The solid line between periods 7 and 8 separates the prenatal from the postnatal period.

