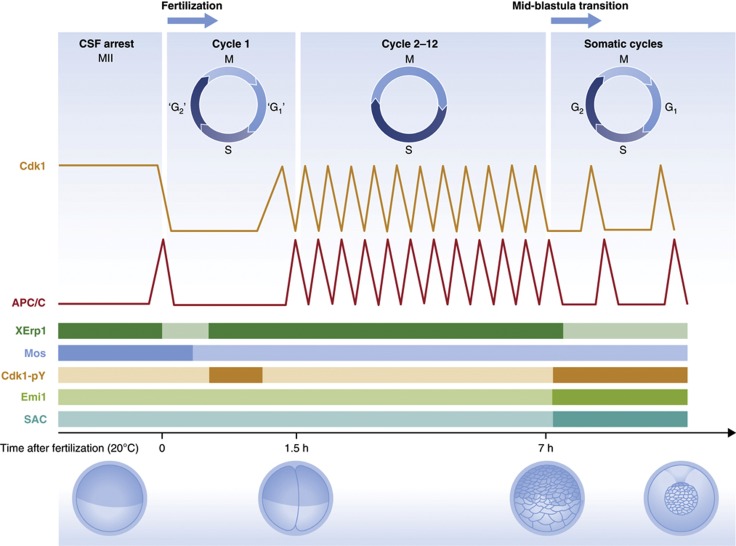
Figure 1.
Schematic representation of cell cycle regulation during Xenopus early development. Illustrated are specialized cell cycle types, major developmental transitions and oocyte/embryo stages, as well as oscillations of Cdk1–cyclin B and APC/C activity. Bars in the lower half depict activity levels for XErp1/Emi2, c-Mos/MAPK, Emi1 and the spindle assembly checkpoint (SAC), as well as inhibitory Thr-14/Tyr-15 phosphorylation of Cdk1 (Cdk1-pY). See text for details.

