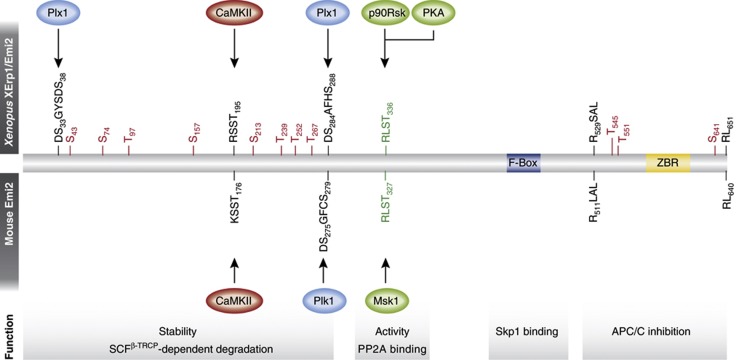
Figure 3.
XErp1/Emi2 regulation in Xenopus and mouse. Depicted is the primary sequence structure of frog (upper) and mouse (lower) XErp1/Emi2, with functional elements and sites of regulatory modifications spaced according to the complete Xenopus protein. Red and green letters denote sites with negative and positive effects on XErp1’s function, respectively. Red S/T sites in Xenopus XErp1/Emi2 are targets for inhibitory phosphorylation by Cdk1, while ‘DS…’ sequences denote phosphodegrons regulating XErp1/Emi2 stability. Plx1, Xenopus Polo-like kinase 1; ZBR, zinc-binding region. See text for details.

