
Figure 4.
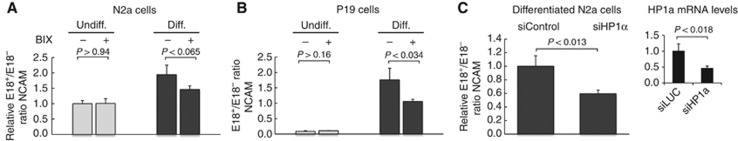
H3K9 methylation and HP1α recruitment contribute to the upregulation of E18 inclusion in differentiated cells. Responsiveness of N2a cells (A) and P19 cells (B) to treatment with BIX before and after differentiation assessed by real-time quantitative RT–PCR. Cells were treated with 1 μM BIX for 3 days. Each individual value corresponds to the mean±s.d. of three replicates. (C) Responsiveness of differentiated N2a cells to treatment with a siRNA against HP1α (siHP1α) or a siRNA control against luciferase (siControl). All values are expressed as mean±s.d., relativized to values of cells transfected with the siControl. The inset shows the steady-state mRNA levels of HP1α measured by real-time RT–PCR, showing a near 50% depletion efficiency. P values correspond to two-tailed Student’s t test (n=3).