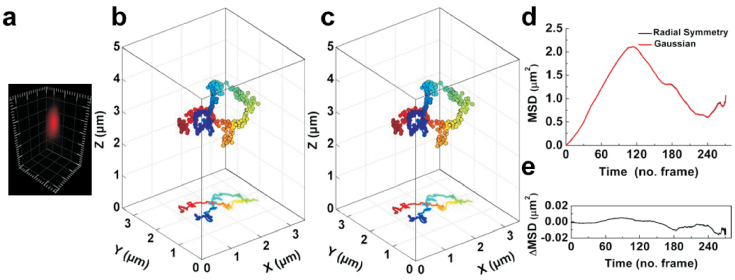
Figure 3. Three-dimensional tracking individual quantum dots-labeled influenza viruses in live cells.
(a) 3D images of single virus labeled with QDs for tracking. The length between major tickmark is 1 μm. (b, c) Trajectories of the single virus given by radial symmetry (b) and Gaussian fitting methods (c), respectively. The color of the trajectories indicates a time axis from blue to red. (d) MSD-Time plots of the trajectories analyzed by radial symmetry and Gaussian fitting methods. The difference between the two plots is shown in (e).

