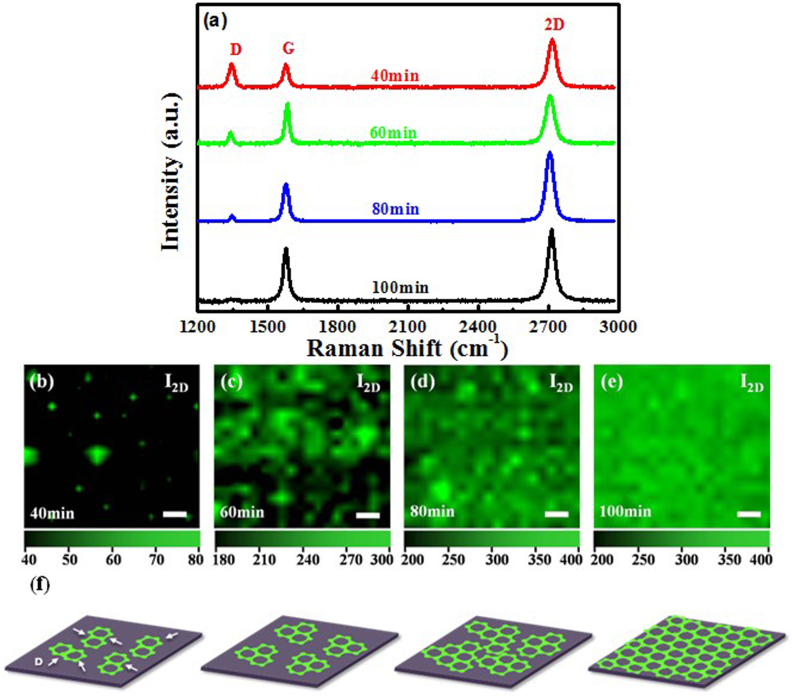
Figure 4. Characterization of graphene grown on Ge substrates for different durations and illustration of graphene growth evolution.
(a) Raman spectra of graphene films deposited on Ge under optimal conditions for different time. (b–e) Color-coded Raman mapping of the 2D peak intensity images of graphene as a function of deposition time. The green features are graphene domains and the dark regions represent the bare Ge surface. The scale bar is 2 μm. (f) Schematic illustration of evolution of the graphene films on Ge for different deposition time.

