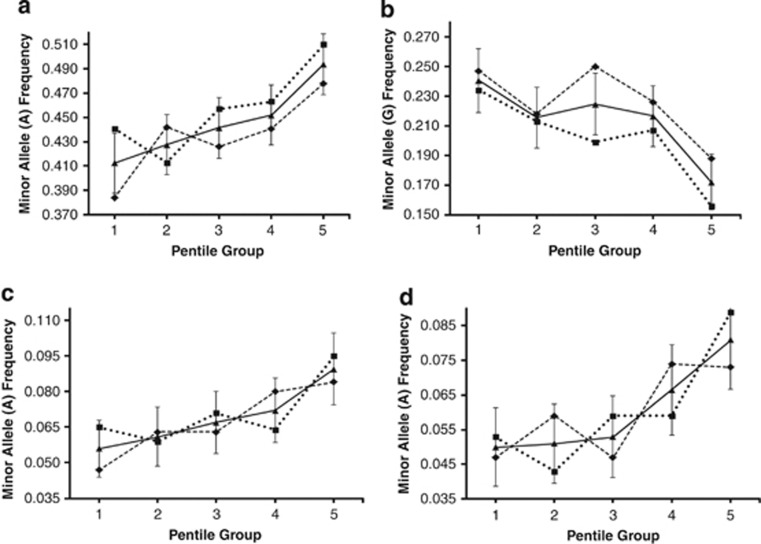
Figure 3.
Minor allele frequencies at the significantly associated SNP loci in the association discovery ( ) and validation (
 ) half-samples, and in the pooled (
 ) sample (±SD in the pooled sample) in PGs. (a) rs266087 (CXCL12), (b) rs598493 (TNFAIP3), (c) rs17180481 (MARCO) and (d) rs17180600 (MARCO).

