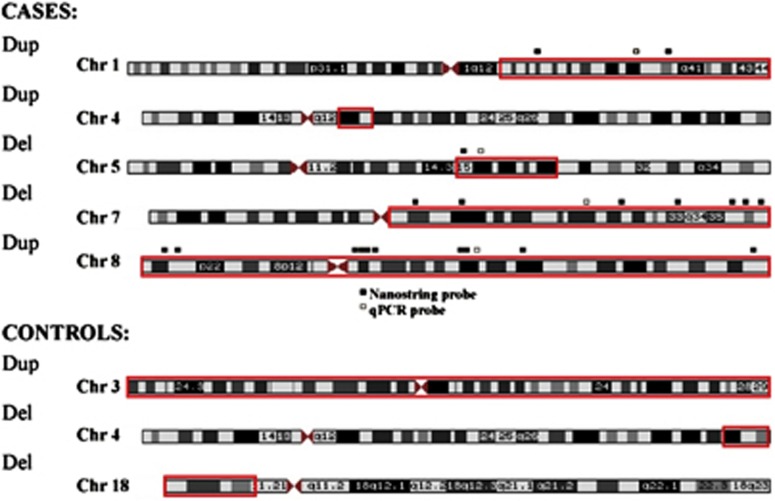
Figure 3.
Non-centromeric CNVs >10 Mb identified in a refined set of outlier subjects. Red squares indicate where on the chromosome the loss (del) or gain (dup) occurred. Regions of quantitative PCR (qPCR) and nanostring probe binding are marked by small squares adjacent to chromosome images. A full color version of this figure is available at the European Journal of Human Genetics journal online.

