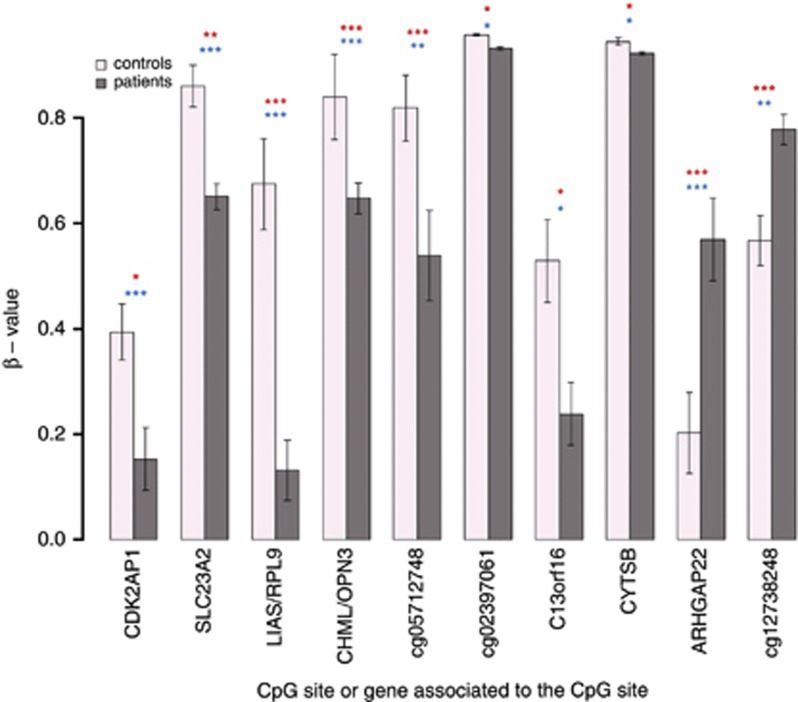
Figure 2.
Bar plot of the β-values of 10 CpG sites significantly different methylated in patients than in controls for both analyzed group. First and second analyzed groups are pooled. The vertical black lines are the standard errors of the means. The significance level is presented as * if 0.05>P-value>0.01, ** if 0.01>P-value>0.001 and *** if P-value<0.001 in blue for first analyzed group and in red for second analyzed group.

