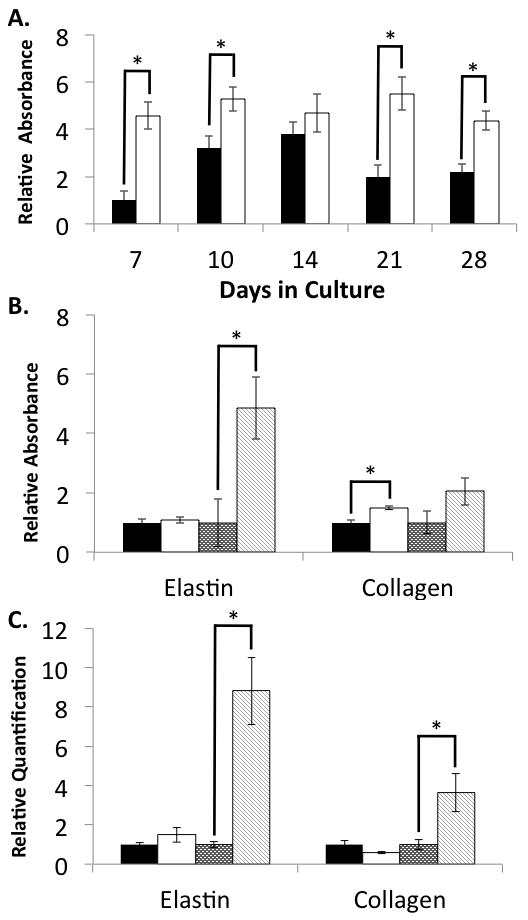
Figure 4. Elastin and collagen expression in pulmonary fibroblasts within 3D Gelfoam matrices.

NNRLFs were cultured Gelfoam sponges for the indicated time in the presence and absence ascorbate (10 mM). NNRLF-Gelfoam samples were fixed and ELISAs conducted with anti-elastin or anti-collagen antibodies as described in “Materials and Methods” (A and B). For relative mRNA quantitation (C) cells were extracted and analyzed by qPCR. (A) Elastin levels were determined in control (filled bars) ascorbate treated (open bars) NNRLF-Gelfoam constructs and normalized to the non-treated control sample at day 7 (average of 4 samples ±SEM; p < 0.05 for ascorbate versus control for all but the day 14 time point). (B) Elastin and collagen protein levels within NNRLF-Gelfoam constructs were measured by ELISA after 14 days without (black bars) and with (white bars) ascorbate, and 21 days without (dark stippled bars) and with (light cross-hatched bars) ascorbate. Data at each time point were normalized to the untreated control sample (average of 10 samples ±SEM; p < 0.05 for day 21 elastin ascorbate versus control and for collagen at day 14). (C) Elastin and collagen mRNA levels within the NNRLF-Gelfoam constructs were measured at days 14 (N = 5) and 21 (N = 6) in control and ascorbate treated cultures (bar code described above for panel (B)). Data at each time point were normalized to the untreated control sample (average ±SEM; p < 0.05 for elastin and collagen ascorbate versus control at day 21).
