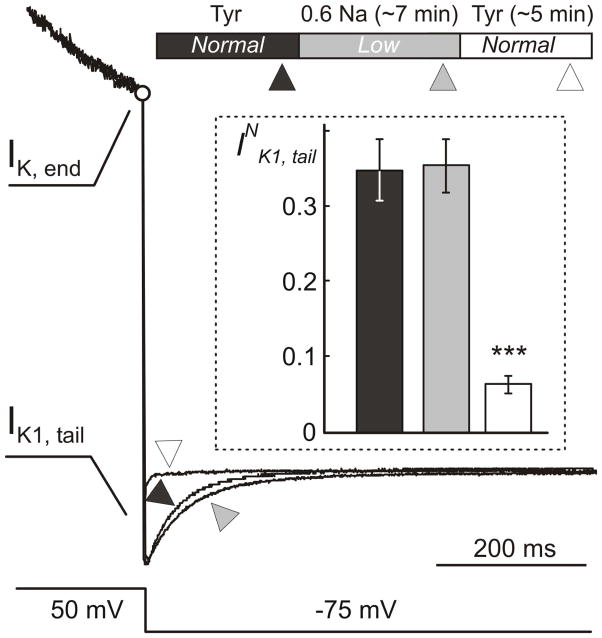
Figure 7. Time course of electrophysiological remodeling during hypo-osmotic stress.
Example of whole-cell currents in response to voltage protocol as in Fig. 6A recorded in the same myocyte at different times during hypo-osmotic stress and its resolution. (Top) The timing of the application of Tyrode (Tyr) and hypo-osmotic 0.6 Na solutions (Normal and Low osmolarity). Ionic currents were recorded within ~1–2 min before application of 0.6 Na solution (▲), ~1–2 min before (
 ) and ~3–6 min (△) after its removal. Current traces were normalized to each other at the end of depolarizing voltage step (IK, end; ○) in order to highlight the relative changes in IK1, tail currents. Fast capacitative transient upon repolarization is not shown. Insert: Quantification of the data shows that IK1, tail currents are not affected by the hypo-osmotic stress itself but are significantly reduced (by ~5 fold; p<0.001) shortly after resolution of the shock.

