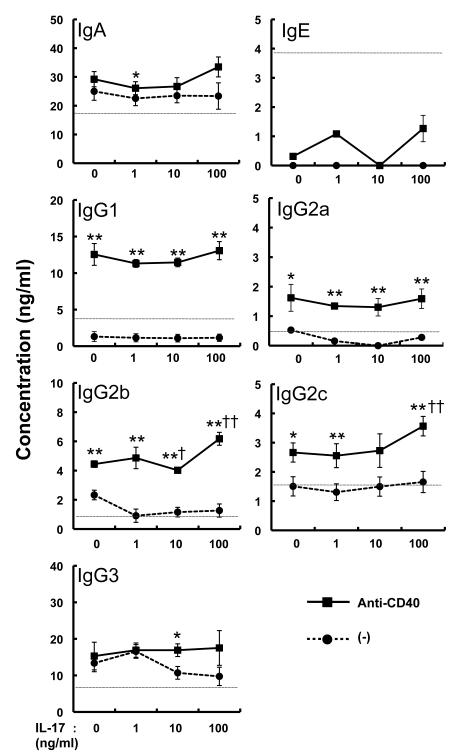
Figure 3. Effect of IL-17 on B-cell Ig production.
Splenic B cells (2 × 10⁶ cells/ml) were stimulated with various concentrations of IL-17 in the presence and absence of anti-CD40 mAb for 6 days. The levels of IgA, IgE, IgG1, IgG2a, IgG2b, IgG2c and IgG3 in the culture supernatants were measured by ELISA. Data show the mean ± SEM (n = 6). *p<0.05, **p<0.01 vs. (-) (without anti-CD40 mAb); and †p=0.05, ††p<0.01 vs. IL-17 = 0 ng/ml (with anti-CD40). Similar results were obtained in four independent experiments. The dashed line is the threshold for the limit of detection by ELISA.

