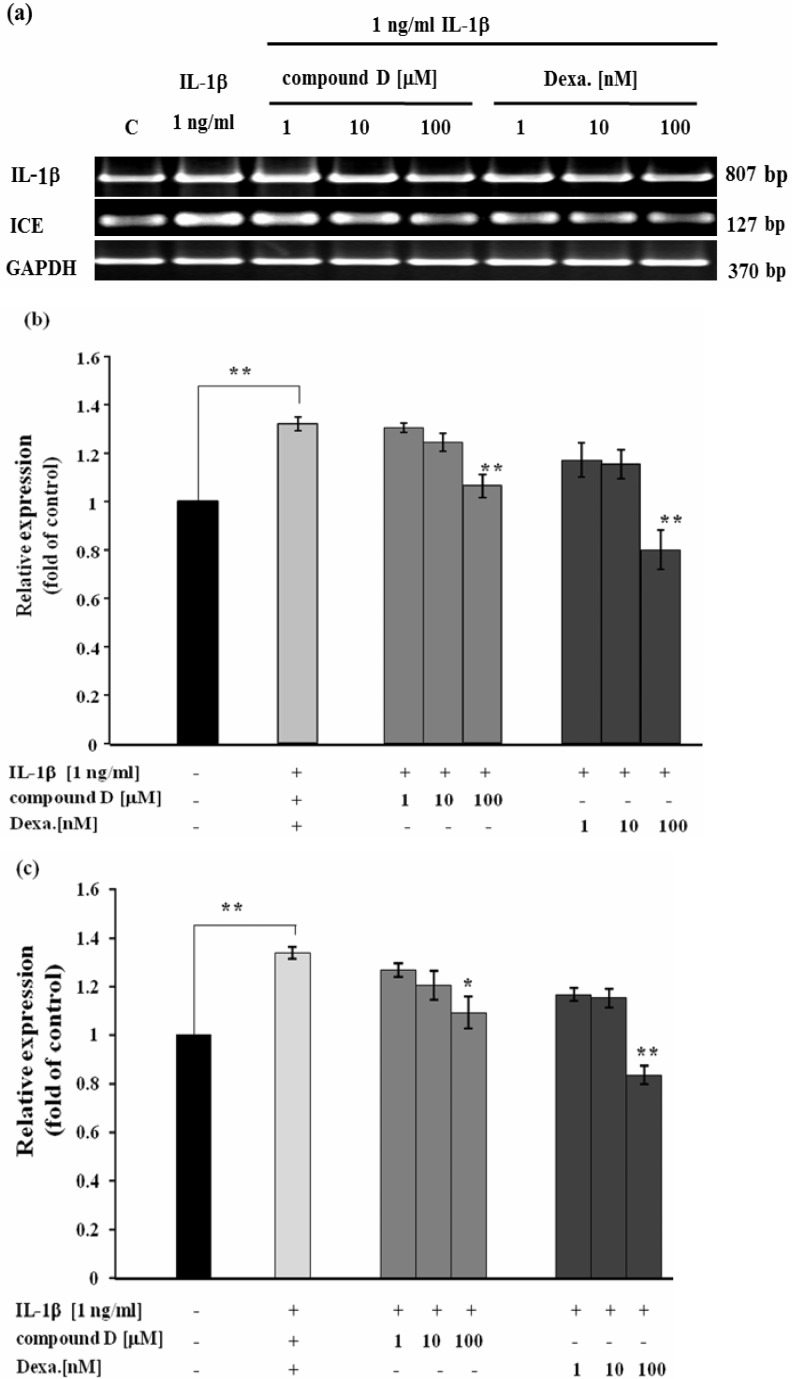
Figure 4.
Effect of compound D on IL-1β -induced expression of IL-1β and ICE genes analyzed by semiquantitative RTPCR; (a) representative images of agarose gel electrophoresis, bar graphs indicating relative expression of IL-1β (b) and ICE (c) as fold change compared to the control (C). SW982 cells were treated with 1 ng/ml IL-1β in with or without the various concentrations of compound D or dexamethasone (Dexa). After 24 hours, mRNA levels of IL-1β and ICE genes were analyzed by semiquantitative RT-PCR. The bar graph is presented as mean + SD of three independent experiments. The significant differences were evaluated by one-way ANOVA. Asterisks denote values significantly different from IL-1β -treated group; P<0.05 (*) and P< 0.01 (**), respectively.

