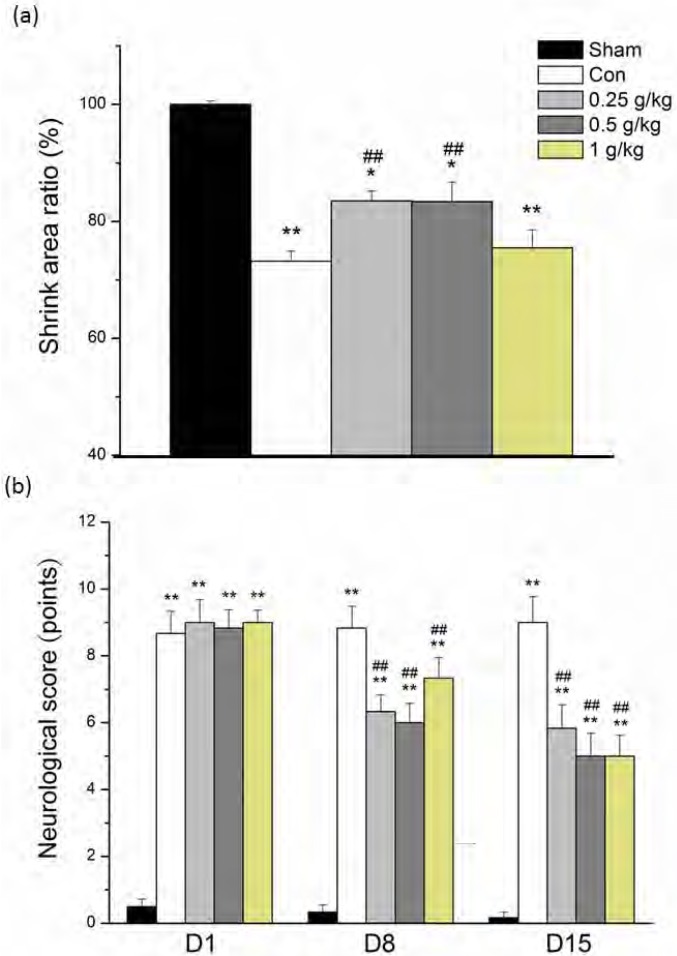
Figure 2.
The cerebral infarction areas and scores for neurological deficit in the sham, control, and PA treatment groups (0.25 g/kg, 0.5 g/kg, and 1g/kg). (a) The ratio of shrunken area compared with the sham group (Sham). (b) MCAo-induced neurological deficit scores for each group were recorded on days 1 (D1), 8 (D8), and 15 (D15) after MCAo. * P < .05 compared with the sham group. ** P < .01 compared with sham group. ## P < .01 compared with control group (Con).

