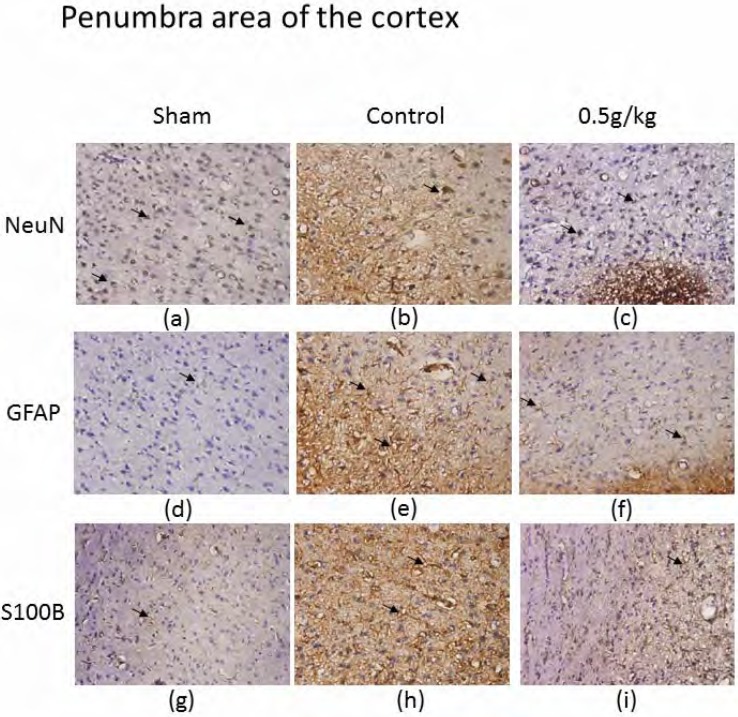
Figure 3.
Immunostaining of hematoxylin and eosin (HE), NeuN, GFAP, and S100B in penumbra area of the cortex of sham, control, and 0.5 g/kg PA-treated groups. HE (blue) and NeuN (brown) positive staining in penumbra area of the cortex in sham (a), control (b), and 0.5 g/kg PA (c) groups. HE (blue) and GFAP (brown) positive stained cells in sham (d), control (e), and 0.5 g/kg PA (f) groups. HE (blue) and S100B (brown) positive stained cells in sham (g), control (h), and 0.5 g/kg PA (i) groups. The arrows indicate positive staining. The pictures were captured at 100 × magnification.

