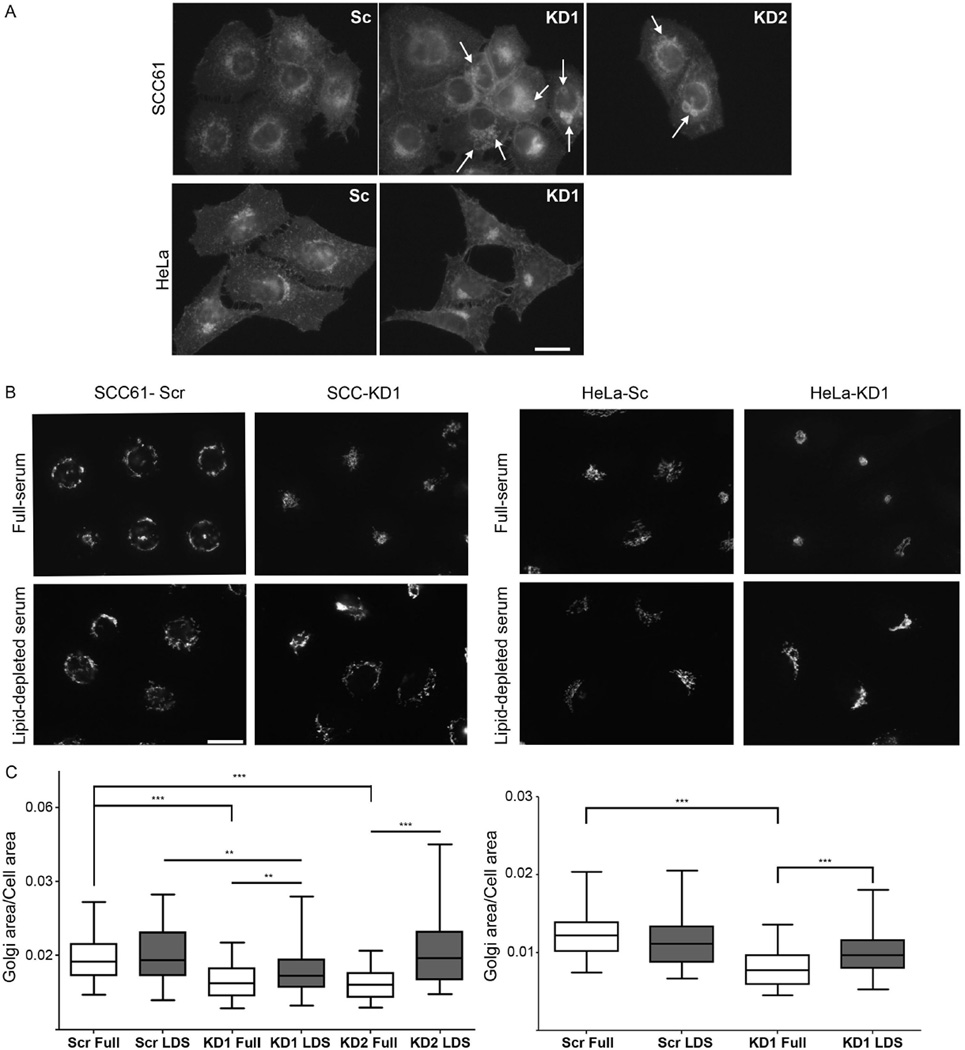
Figure 8. Lipid-depletion rescues Golgi morphology defects in cortactin-KD cells.
A. Representative images of SCC61 (top panels) and HeLa (lower panels) control (Scr) and cortactin-KD (KD1, KD2) cells stained for free cholesterol with filipin. Arrows point to large filipin-positive vacuoles and vesicular compartments. B. Representative images of GM130 immunofluorescence in cells cultured in full serum (top panels) and lipid-depleted serum (LDS, bottom panels). C. Ratio of Golgi area to total cell area for SCC61 cells (left) and HeLa cells (right) in full serum or LDS. n = 3, with >22 cells per independent experiment; all data plotted (>85 cells per cell line). Scale bar = 25 µm. Data are presented as box and whiskers plots with the box indicating the 25th and 75th percentiles, solid line indicating the median, and the whiskers indicating the 95% confidence intervals.**p<0.01; ***p<0.001.

