
Figure 1.
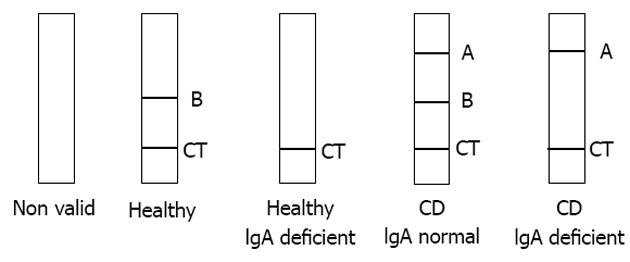
Celiac disease lateral-flow immunochromatographic assay visual result interpretation. CT: Control line; A: Position for detection of IgA and IgG anti-DGP; B: Position for detection of total IgA; CD: Celiac disease; IgA: Immunoglobulin A.
Official websites use .gov
A
.gov website belongs to an official
government organization in the United States.
Secure .gov websites use HTTPS
A lock (
) or https:// means you've safely
connected to the .gov website. Share sensitive
information only on official, secure websites.
Celiac disease lateral-flow immunochromatographic assay visual result interpretation. CT: Control line; A: Position for detection of IgA and IgG anti-DGP; B: Position for detection of total IgA; CD: Celiac disease; IgA: Immunoglobulin A.